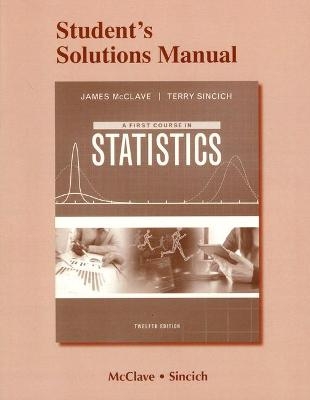
Student Solutions Manual for First Course in Statistics, A
Pearson (Verlag)
978-0-13-408101-4 (ISBN)
- Titel z.Zt. nicht lieferbar
- Versandkostenfrei innerhalb Deutschlands
- Auch auf Rechnung
- Verfügbarkeit in der Filiale vor Ort prüfen
- Artikel merken
Dr. Jim McClave is currently President and CEO of Info Tech, Inc., a statistical consulting and software development firm with an international clientele. He is also currently an Adjunct Professor of Statistics at the University of Florida, where he was a full-time member of the faculty for twenty years. Dr. Terry Sincich obtained his PhD in Statistics from the University of Florida in 1980. He is an Associate Professor in the Information Systems & Decision Sciences Department at the University of South Florida in Tampa. Dr. Sincich is responsible for teaching basic statistics to all undergraduates, as well as advanced statistics to all doctoral candidates, in the College of Business Administration. He has published articles in such journals as the Journal of the American Statistical Association, International Journal of Forecasting, Academy of Management Journal, and Auditing: A Journal of Practice & Theory. Dr. Sincich is a co-author of the texts Statistics, Statistics for Business & Economics, Statistics for Engineering & the Sciences, and A Second Course in Statistics: Regression Analysis.
Table of Contents
Statistics, Data, and Statistical Thinking
1.1 The Science of Statistics
1.2 Types of Statistical Applications
1.3 Fundamental Elements of Statistics
1.4 Types of Data
1.5 Collecting Data: Sampling and Related Issues
1.6 The Role of Statistics in Critical Thinking and Ethics
Statistics in Action: Social Media Network Usage-Are You Linked In?
Using Technology: MINITAB: Accessing and Listing Data
Methods for Describing Sets of Data
2.1 Describing Qualitative Data
2.2 Graphical Methods for Describing Quantitative Data
2.3 Numerical Measures of Central Tendency
2.4 Numerical Measures of Variability
2.5 Using the Mean and Standard Deviation to Describe Data
2.6 Numerical Measures of Relative Standing
2.7 Methods for Detecting Outliers: Box Plots and z-Scores
2.8 Graphing Bivariate Relationships (Optional)
2.9 Distorting the Truth with Descriptive Statistics
Statistics in Action: Body Image Dissatisfaction: Real or Imagined?
Using Technology: MINITAB: Describing Data
TI-83/TI—84 Plus Graphing Calculator: Describing Data
Probability
3.1 Events, Sample Spaces, and Probability
3.2 Unions and Intersections
3.3 Complementary Events
3.4 The Additive Rule and Mutually Exclusive Events
3.5 Conditional Probability
3.6 The Multiplicative Rule and Independent Events
Statistics in Action: Lotto Buster! Can You Improve Your Chance of Winning?
Using Technology: TI-83/TI-84 Plus Graphing Calculator: Combinations and Permutations
Random Variables and Probability Distributions
4.1 Two Types of Random Variables
4.2 Probability Distributions for Discrete Random Variables
4.3 The Binomial Random Variable
4.4 Probability Distributions for Continuous Random Variables
4.5 The Normal Distribution
4.6 Descriptive Methods for Assessing Normality
4.7 Approximating a Binomial Distribution with a Normal Distribution (Optional)
4.8 Sampling Distributions
4.9 The Sampling Distribution of x and the Central Limit Theorem
Statistics in Action: Super Weapons Development — Is the Hit Ratio Optimized?
Using Technology: MINITAB: Discrete Probabilities
Inferences Based on a Single Sample
5.1 Identifying and Estimating the Target Parameter
5.2 Confidence Interval for a Population Mean: Normal (z) Statistic
5.3 Confidence Interval for a Population Mean: Student’s t-Statistic
5.4 Large-Sample Confidence Interval for a Population Proportion
5.5 Determining the Sample Size
5.6 Confidence Interval for a Population Variance (Optional)
Statistics in Action: Medicare Fraud Investigations
Using Technology: MINITAB: Confidence Intervals
Inferences Based on a Single Sample
6.1 The Elements of a Test of Hypothesis
6.2 Formulating Hypotheses and Setting Up the Rejection Region
6.3 Observed Significance Levels: p-values
6.4 Test of Hypothesis about a Population Mean: Normal (z) Statistic
6.5 Test of Hypothesis about a Population Mean: Student’s t-Statistic
6.6 Large-Sample Test of Hypothesis about a Population Proportion
6.7 Test of Hypothesis about a Population Variance (Optional)
6.8 A Nonparametric Test about a Population Median (Optional)
Statistics in Action: Diary of a KLEENEX User How Many Tissues in a Box?
Using Technology: MINITAB: Tests of Hypotheses
TI-83/TI-84 Plus Graphing Calculator: Tests of Hypotheses
Comparing Population Means
7.1 Identifying the Target Parameter
7.2 Comparing Two Population Means: Independent Sampling
7.3 Comparing Two Population Means: Paired Difference Experiments
7.4 Determining the Sample Size
7.5 A Nonparametric Test for Comparing Two Populations: Independent Samples
7.6 A Nonparametric Test for Comparing Two Populations: Paired Difference Experiment (Optional)
7.7 Comparing Three or More Population Means: Analysis of Variance (Optional)
Statistics in Action: Zixlt Corp. vs. Visa USA Inc. — A Libel Case
Using Technology: MINITAB: Comparing Means
TI-83/TI-84 Plus Graphing Calculator: Comparing Means
Comparing Population Proportions
8.1 Comparing Two Population Proportions: Independent Sampling
8.2 Determining Sample Size
8.3 Testing Category Probabilities: Multinomial Experiment
8.4 Testing Categorical Probabilities: Two-Way (Contingency) Table
Simple Linear Regression
9.1 Probabilistic Models
9.2 Fitting the Model: The Least Squares Approach
9.3 Model Assumptions
9.4 Assessing the Utility of the Model: Making Inferences about the Slope β1
9.5 The Coefficients of Correlation and Determination
9.6 Using the Model for Estimation and Prediction
9.7 A Complete Example
9.8 A Nonparametric Test for Correlation (Optional)
Statistics in Action: Can “Dowsers” Really Detect Water?
Using Technology: MINITAB: Simple Linear Regression
TI-83/TI-84 Plus Graphing Calculator: Simple Linear Regression
Appendices Short Answers to Selected Odd-Numbered Exercises Index Photo Credits
| Erscheinungsdatum | 03.03.2016 |
|---|---|
| Sprache | englisch |
| Maße | 216 x 279 mm |
| Gewicht | 771 g |
| Themenwelt | Mathematik / Informatik ► Mathematik ► Statistik |
| Sozialwissenschaften ► Pädagogik | |
| ISBN-10 | 0-13-408101-3 / 0134081013 |
| ISBN-13 | 978-0-13-408101-4 / 9780134081014 |
| Zustand | Neuware |
| Informationen gemäß Produktsicherheitsverordnung (GPSR) | |
| Haben Sie eine Frage zum Produkt? |
aus dem Bereich


