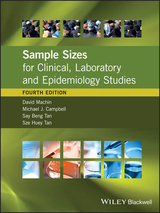
Sample Size Tables for Clinical Studies
Wiley-Blackwell (an imprint of John Wiley & Sons Ltd) (Verlag)
978-1-4051-4650-0 (ISBN)
- Titel ist leider vergriffen;
keine Neuauflage - Artikel merken
This book provides statisticians and researchers with the statistical tools - equations, formulae and numerical tables - to design and plan clinical studies and carry out accurate, reliable and reproducible analysis of the data so obtained. There is no way around this as incorrect procedure in clinical studies means that the researcher's paper will not be accepted by a peer-reviewed journal. Planning and analysing clinical studies is a very complicated business and this book provides indispensible factual information.
David Machin, Children's Cancer and Leukaemia Group, University of Leicester, UK; Division of Clinical Trials and Epidemiological Sciences, National Cancer Centre, Singapore; Medical Statistics Unit, School of Health and Related Sciences, University of Sheffield, UK Michael J. Campbell, Medical Statistics Unit, School of Health and Related Sciences, University of Sheffield, UK Say Beng Tan, Singapore Clinical Research Institute, Singapore; Duke-NUS Graduate Medical School, Singapore Sze Huey Tan, Division of Clinical Trials and Epidemiological Sciences, National Cancer Centre, Singapore
Preface, viii. 1 Basic design considerations, 1 2 Distributions and confidence intervals, 14 Table 2.1 The Normal distribution functionaprobability that a Normally distributed variable is less than z, 27 Table 2.2 Percentage points of the Normal distribution for a and 1 - ss, 28 Table 2.3 Values of ?(a, ss) = (z1-a/2 + z1-ss)2, 28 Table 2.4 The t-distribution, 29 3 Comparing two independent groups for binary data, 30 Table 3.1 Sample size for the comparison of two proportions, 38 Table 3.2 Sample size for the comparison of two proportions using the odds ratio (OR), 40 4 Comparing two independent groups for ordered categorical data, 42 5 Comparing two independent groups for continuous data, 47 Table 5.1 Sample sizes for the two sample t-test with two-sided a = 0.05, 54 Table 5.2 Sample sizes for the two sample t-test with unequal variances, 55 Table 5.3 Sample sizes for the one sample t-test with two-sided a = 0.05, 57 6 Cluster designs, repeated measures data and more than two groups, 58 Table 6.1 Multiplying factor for repeated measures designs, 66 7 Comparing paired groups for binary, ordered categorical and continuous outcomes, 67 Table 7.1 Sample sizes for paired binary data, 80 Table 7.2 Sample sizes for paired continuous data with two-sided a = 0.05, 81 8 Comparing survival curves, 82 Table 8.1 Number of critical events for comparison of survival rates (Logrank test), 95 Table 8.2 Number of subjects for comparison of survival rates (Logrank test), 97 Table 8.3 Number of critical events for comparison of two exponential survival distributions with two-sided a = 0.05, 99 9 Equivalence, 100 Table 9.1 Sample sizes for bioequivalence studiesadifference between two means or ratio of two means, 115 Table 9.2 Sample sizes for testing the equivalence of two means, 116 Table 9.3 Sample sizes for testing the equivalence of two proportions, 118 10 Confidence intervals, 120 Table 10.1 Sample sizes required to observe a given confidence interval width for a given proportion in a sample from a large population, 134 Table 10.2 Sample sizes required to observe a given confidence interval width for the difference between two proportionsaindependent groups, 135 Table 10.3 Sample sizes required to observe a proportionate confidence interval width for the difference between two groups expressed via the odds ratio (OR), 136 Table 10.4 Sample sizes required to observe a given confidence interval width for the difference between two proportions from paired or matched groups, 137 Table 10.5 Sample sizes required to observe a given confidence interval width to estimate a single mean or the difference between two means for independent or matched groups, 139 11 Post-marketing surveillance, 140 Table 11.1 Sample sizes required to observe a total of a adverse reactions with a given probability 1 - ss and anticipated incidence ?, 147 Table 11.2 Sample sizes required for detection of a specific adverse reaction with background incidence, ?0, known, 148 Table 11.3 Sample sizes required for detection of a specific adverse reaction with background incidence unknown, 149 Table 11.4 Number of cases to be observed in a case-control study, 150 12 The correlation coefficient, 151 Table 12.1 Sample sizes for detecting a statistically significant correlation coefficient, 155 13 Reference intervals and receiver operating curves, 156 Table 13.1 Sample sizes in order to obtain a required reference intervalaNormal distribution, 167 Table 13.2 Sample sizes in order to obtain a required reference intervalanon-Normal distribution, 168 Table 13.3 Sample sizes required to observe a given sensitivity and specificity in diagnostic accuracy studiesasingle sample, 169 Table 13.4 Sample sizes required to observe a given sensitivity and specificity in diagnostic accuracy studiesatwo sample unpaired design, 171 Table 13.5 Sample sizes required to observe a given sensitivity and specificity in diagnostic accuracy studiesatwo sample matched paired design, 173 Table 13.6 Sample sizes required to observe a given confidence interval width for receiver operating curves (ROC), 175 14 Observer agreement studies, 177 Table 14.1 Sample sizes required to observe a given confidence interval to estimate the proportion of disagreements between two observers, 187 Table 14.2 Sample sizes required to observe a given confidence interval to estimate the within observer variation, 188 Table 14.3 Sample sizes required to observe a given confidence interval to minimise the number of subjects required to achieve the desired precision in the probability of their disagreement, TDis, 189 Table 14.4 Sample sizes required to observe a given confidence interval width for inter-observer agreement using Cohen's Kappa?, 190 Table 14.5 Sample sizes required to observe a given intra-class correlation using confidence interval approach, 191 Table 14.6 Sample sizes required to observe a given intra-class correlation using hypothesis testing approach with two-sided a = 0.05, 192 15 Dose finding studies, 193 16 Phase II trials, 205 Table 16.1 Fleming-A'Hern single-stage Phase II design, 223 Table 16.2 Gehan two-stage Phase II designaStage 1, 224 Table 16.3 Gehan two-stage Phase II designaStage 2, 225 Table 16.4 Simon Optimal and Minimax designs, 226 Table 16.5 Bayesian single threshold design (STD), 227 Table 16.6 Bayesian dual threshold design (DTD), 228 Table 16.7 Case and Morgan design (EDA) with a = 0.05, 229 Table 16.8 Case and Morgan design (ETSL) with a = 0.05, 230 Table 16.9 Simon, Wittes and Ellenberg design, 231 Table 16.10 Bryant and Day design, 233 17 Sample size software , 235 Cumulative references, 237 Index, 247
| Erscheint lt. Verlag | 21.11.2008 |
|---|---|
| Verlagsort | Chicester |
| Sprache | englisch |
| Maße | 195 x 248 mm |
| Gewicht | 712 g |
| Themenwelt | Medizin / Pharmazie |
| ISBN-10 | 1-4051-4650-8 / 1405146508 |
| ISBN-13 | 978-1-4051-4650-0 / 9781405146500 |
| Zustand | Neuware |
| Informationen gemäß Produktsicherheitsverordnung (GPSR) | |
| Haben Sie eine Frage zum Produkt? |
aus dem Bereich


