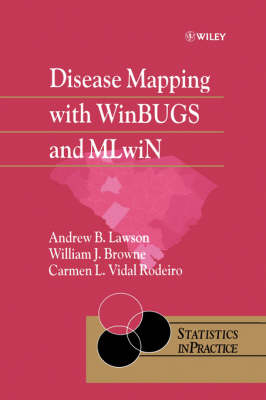
Disease Mapping with WinBUGS and MLwiN
John Wiley & Sons Inc (Verlag)
978-0-470-85604-8 (ISBN)
- Lieferbar (Termin unbekannt)
- Versandkostenfrei innerhalb Deutschlands
- Auch auf Rechnung
- Verfügbarkeit in der Filiale vor Ort prüfen
- Artikel merken
Provides an introduction to Bayesian and multilevel modelling in disease mapping.
Adopts a practical approach, with many detailed worked examples.
Includes introductory material on WinBUGS and MLwiN.
Discusses three applications in detail – relative risk estimation, focused clustering, and ecological analysis.
Suitable for public health workers and epidemiologists with a sound statistical knowledge.
Supported by a Website featuring data sets and WinBUGS and MLwiN programs.
Disease Mapping with WinBUGS and MLwiN provides a practical introduction to the use of software for disease mapping for researchers, practitioners and graduate students from statistics, public health and epidemiology who analyse disease incidence data.
Andrew B. Lawson is a professor of biostatistics and eminent scholar in the Division of Biostatistics and Epidemiology in the College of Medicine at the Medical University of South Carolina. He is an ASA fellow and an advisor in disease mapping and risk assessment for the World Health Organization. Dr. Lawson has published over 100 journal papers and eight books and is the founding editor of Spatial and Spatio-temporal Epidemiology. He received a PhD in spatial statistics from the University of St. Andrews. His research interests include the analysis of clustered disease maps, spatial and spatio-temporal disease surveillance, nutritional measurement error, and Bayesian latent variable and SEM modeling.
Preface. Notation.
0.1 Standard notation for multilevel modelling.
0.2 Spatial multiple-membership models and the MMMC notation.
0.3 Standard notation for WinBUGS models.
1. Disease mapping basics.
1.1 Disease mapping and map reconstruction.
1.2 Disease map restoration.
2. Bayesian hierarchical modelling.
2.1 Likelihood and posterior distributions.
2.2 Hierarchical models.
2.3 Posterior inference.
2.4 Markov chain Monte Carlo methods.
2.5 Metropolis and Metropolis–Hastings algorithms.
2.6 Residuals and goodness of fit.
3. Multilevel modelling.
3.1 Continuous response models.
3.2 Estimation procedures for multilevel models.
3.3 Poisson response models.
3.4 Incorporating spatial information.
3.5 Discussion.
4. WinBUGS basics.
4.1 About WinBUGS.
4.2 Start using WinBUGS.
4.3 Specification of the model.
4.4 Model fitting.
4.5 Scripts.
4.6 Checking convergence.
4.7 Spatial modelling: GeoBUGS.
4 .8 Conclusions.
5. MLwiN basics.
5.1 About MLwiN.
5.2 Getting started.
5.3 Fitting statistical models.
5.4 MCMC estimation in MLwiN.
5.5 Spatial modelling.
5.6 Conclusions.
6. Relative risk estimation.
6.1 Relative risk estimation using WinBUGS.
6.2 Spatial prediction.
6.3 An analysis of the Ohio dataset using MLwiN.
7. Focused clustering: the analysis of putative health hazards.
7.1 Introduction.
7.2 Study design.
7.3 Problems of inference.
7.4 Modelling the hazard exposure risk.
7.5 Models for count data.
7.6 Bayesian models.
7.7 Focused clustering in WinBUGS.
7.8 Focused clustering in MLwiN.
8. Ecological analysis.
8.1 Introduction.
8.2 Statistical models.
8.3 WinBUGS analyses of ecological datasets.
8.4 MLwiN analyses of ecological datasets.
9. Spatially-correlated survival analysis.
9.1 Survival analysis in WinBUGS.
9.2 Survival analysis in MLwiN.
10. Epilogue.
Appendix 1: WinBUGS code for focused clustering models.
A.1: Falkirk example.
A.2: Ohio example.
Appendix 2: S-Plus function for conversion to GeoBUGS format.
Bibliography.
Index.
| Erscheint lt. Verlag | 8.8.2003 |
|---|---|
| Reihe/Serie | Statistics in Practice |
| Verlagsort | New York |
| Sprache | englisch |
| Maße | 162 x 230 mm |
| Gewicht | 567 g |
| Themenwelt | Informatik ► Office Programme ► Outlook |
| Mathematik / Informatik ► Mathematik | |
| Studium ► Querschnittsbereiche ► Prävention / Gesundheitsförderung | |
| ISBN-10 | 0-470-85604-1 / 0470856041 |
| ISBN-13 | 978-0-470-85604-8 / 9780470856048 |
| Zustand | Neuware |
| Haben Sie eine Frage zum Produkt? |
aus dem Bereich


