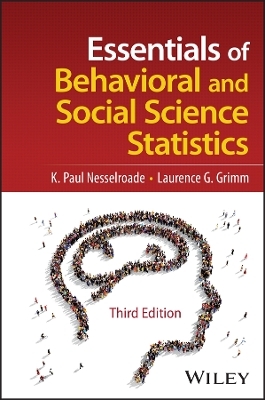
Essentials of Behavioral and Social Science Statistics
John Wiley & Sons Inc (Verlag)
978-1-394-18410-1 (ISBN)
The Third Edition of Essentials of Behavioral and Social Science Statistics prompts the student to develop a deep understanding of the psychometric principles involved in the research process, as well as a mastery of the particular functionality of the most common statistical tools and an ability to properly select and use them in the real world; this goal is achieved thanks to the organization of the text, the philosophical content interspersed within it, the depth of the exercises and work problems, and the supporting materials provided for the instructor and student.
The Third Edition has been thoroughly edited and streamlined to allow for students to move efficiently through the conceptual and mathematical fundamentals and on to the payoff formulas and descriptions of applications. New content includes philosophical issues associated with psychometrics and inferential statistical testing, interpretation, measurement, and the replication crisis in the social sciences. End-of-chapter exercises and work problems have been strengthened and reorganized to further improve comprehension and performance. Section reviews that draw on concepts from all preceding chapters are included to help students develop skills of statistical tool selection and application. Support for instructors includes chapter-based learning objectives, test banks, and PowerPoints.
Essentials of Behavioral and Social Science Statistics includes information on:
Basic concepts in research covering the scientific method, types of variables, controlling extraneous variables, validity issues, and causality and correlation
Descriptive statistics including scales of measurement, measures of central tendency and variability, transformations, and standardized scores
The fundamentals of inferential statistics, including probability theory, sampling distributions, the central limit theorem, and the terminology of hypothesis testing
The logic and application of basic inferential tests including single-sample tests, independent-and dependent-samples t tests, and the basics of power analysis
The logic and application of three common ANOVA analyses; one-way, two-way, and repeated-measures
The logic and application of basic bivariate data analysis tools, linear correlation and linear regression
The logic and application of chi-square analyses, both goodness-of-fit and tests-for-independence
Written to facilitate concept mastery and enable practical application of concepts, Essentials of Behavioral and Social Science Statistics offers a survey of basic descriptive and inferential statistical tools and concepts and is highly suitable to support a rigorous undergraduate behavioral science or social science statistics course.
Dr. K. PAUL NESSELROADE Jr., a social psychologist, has been an educator for more than 25 years. During this time, he has taught a variety of psychology courses including numerous sections of Behavioral Statistics, Social Psychology, The History of Psychology, and The Psychology of the Holocaust. Dr. Nesselroade serves as Professor of Psychology, Psychology Department Chair, and Director of the Honors Program at Asbury University. THE LATE LAURENCE G. GRIMM, PhD, was a clinical psychologist and Emeritus Associate Professor, University of Illinois at Chicago.
Preface xv
Acknowledgments xix
About the Companion Website xxi
Introduction 1
1 Basic Concepts in Research 3
1.1 The Scientific Method 3
1.2 The Goals of the Researcher 5
1.3 Types of Variables 7
1.4 Controlling Extraneous Variables 9
1.5 Validity Issues 16
1.6 Causality and Correlation 21
1.7 The Organization of the Textbook 23
Summary 24
Exercises 25
Part 1 Descriptive Statistics 29
2 The Nature, Scales, and Display of Measurements 31
2.1 The Nature of Measurement 31
2.2 Scales of Measurement 33
2.3 Types of Variables and Their Features 37
2.4 Using Tables to Organize Data 40
2.5 Using Graphs to Display Data 45
2.6 The Shape of Things to Come 52
Summary 55
Microsoft® Excel and SPSS® 57
Exercises 57
Work Problems 58
3 Measures of Central Tendency 61
3.1 Describing a Distribution of Scores 61
3.2 Parameters and Statistics 62
3.3 The Rounding Rule 62
3.4 The Mean 63
3.5 The Median 66
3.6 The Mode 69
3.7 Distribution Shape and Measures of Central Tendency 70
3.8 When to Use the Mean, Median, and Mode 71
Summary 74
Microsoft® Excel and SPSS® 75
Exercises 76
Work Problems 76
4 Measures of Variability 79
4.1 The Importance of Measures of Variability 79
4.2 The Range 79
4.3 The Mean Deviation 82
4.4 The Variance 84
4.5 The Standard Deviation 89
4.6 Simple Transformations of the Mean and Variance 91
4.7 Deciding Which Measure of Variability to Use 92
Summary 95
Microsoft® Excel and SPSS® 96
Exercises 97
Work Problems 98
5 The Normal Curve and Transformations 101
5.1 Percentile Rank 101
5.2 Normal Distributions 102
5.3 Standard Scores (z Scores) 106
Summary 116
Microsoft® Excel and SPSS® 117
Exercises 118
Work Problems 118
Part 2 Inferential Statistics: Theoretical Basis 121
6 Basic Concepts of Probability 123
6.1 Theoretical Support for Inferential Statistics 123
6.2 The Taming of Chance 124
6.3 What Is Probability? 126
6.4 The Addition Rule 130
6.5 The Multiplication Rule 133
6.6 Conditional Probabilities 136
Summary 141
Exercises 142
Work Problems 143
7 Hypothesis Testing and Sampling Distributions 147
7.1 Inferential Statistics 147
7.2 Hypothesis Testing 148
7.3 Sampling Distributions 153
7.4 Estimating the Features of Sampling Distributions 158
Summary 160
Exercises 162
Work Problems 163
Part 3 Inferential Statistics: z Test, t Tests, and Power 165
8 The Single-Sample z and t Tests 167
8.1 The Research Context 167
8.2 The Sampling Distribution for the Single-Sample z Test 168
8.3 Type I and Type II Errors 175
8.4 Is a Significant Finding “Significant?” 180
8.5 The Sampling Distribution for the Single-Sample t Test 182
8.6 Assumptions of the Single-Sample z and t Tests 188
8.7 Interval Estimation of the Population Mean 189
8.8 Formal Presentation of Findings 191
Summary 191
Microsoft® Excel and SPSS® 192
Exercises 193
Work Problems 194
9 The Independent- and Dependent-Samples t Tests 199
9.1 The Research Context for Between-Participants Designs 199
9.2 The Independent-Samples t Test 201
9.3 Assumptions of the Independent-Samples t Test 210
9.4 Interval Estimation for Independent Samples 210
9.5 The Research Context for Within-Participants Designs 211
9.6 The Dependent-Samples t Test 213
9.7 Assumptions of the Dependent-Samples t Test 218
9.8 Interval Estimation for Dependent Samples 218
9.9 Comparing the Two Tests 219
9.10 The Appropriateness of Unidirectional Tests 220
9.11 Formal Presentation of Findings 225
Summary 225
Microsoft® Excel and SPSS® 226
Exercises 228
Work Problems 230
10 Power Analysis and Hypothesis Testing 239
10.1 Decision-Making While Hypothesis Testing 239
10.2 Why Study Power? 240
10.3 The Five Factors that Influence Power 241
10.4 Decision Criteria that Influence Power 243
10.5 Determining Effect Size: The Achilles Heel of Power Analyses 247
10.6 Determining Sample Size for a Single-Sample Test 248
Summary 249
Exercises 250
Work Problems 251
Part 3 Review The z Test, t Tests, and Power Analysis 253
Part 4 Inferential Statistics: Analyses of Variance 257
11 One-Way Analysis of Variance 259
11.1 The Research Context 259
11.2 Hypotheses 261
11.3 The Conceptual Basis: Sources of Variation 262
11.4 The Assumptions 265
11.5 Computing the F Ratio 265
11.6 Testing Null Hypotheses 271
11.7 The ANOVA Summary Table 274
11.8 Measuring Effect Size 274
11.9 Locating the Source(s) of Significance 275
11.10 Formal Presentation of Findings 279
Summary 279
Microsoft® Excel and SPSS® 280
Exercises 281
Work Problems 283
12 Two-Way Analysis of Variance 289
12.1 The Research Context 289
12.2 The Logic of the Two-Way ANOVA 300
12.3 Definitional and Computational Formulas 303
12.4 The ANOVA Summary Table 306
12.5 Using the F Ratios to Test Null Hypotheses 307
12.6 The Assumptions 308
12.7 Measuring Effect Sizes 308
12.8 Multiple Comparisons 309
12.9 Interpreting the Factors in a Two-Way ANOVA 314
12.10 Formal Presentation of Findings 315
Summary 315
Microsoft® Excel and SPSS® 316
Exercises 317
Work Problems 320
13 Repeated-Measures Analysis of Variance 325
13.1 The Research Context 325
13.2 The Logic of the Repeated-Measures ANOVA 328
13.3 The Formulas 331
13.4 The ANOVA Summary Table 334
13.5 Using the F Ratio to Test the Null Hypothesis 335
13.6 Interpreting the Findings 335
13.7 The Assumptions 335
13.8 Measuring Effect Size 336
13.9 Locating the Source(s) of Statistical Evidence 337
13.10 Formal Presentation of Findings 338
Summary 339
Microsoft® Excel and SPSS® 339
Exercises 340
Work Problems 341
Part 4 Review Analyses of Variance 347
Part 5 Inferential Statistics: Bivariate Data and Chi-Square Tests 351
14 Linear Correlation 353
14.1 The Research Context 353
14.2 The Correlation Coefficient and Scatter Diagrams 356
14.3 The Coefficient of Determination, r2 362
14.4 Using the Pearson r for Hypothesis Testing 365
14.5 Misleading Correlation Coefficients 368
14.6 Formal Presentation of Findings 372
Summary 372
Microsoft® Excel and SPSS® 373
Exercises 374
Work Problems 376
15 Linear Regression 381
15.1 The Research Context 381
15.2 Overview of Regression 382
15.3 Establishing the Regression Line 386
15.4 Putting It All Together: A Worked Problem 396
15.5 The Pitfalls of Linear Regression 398
15.6 Formal Presentation of Findings 401
Summary 401
Microsoft® Excel and SPSS® 402
Exercises 403
Work Problems 404
16 Chi-Square Tests and Other Nonparametrics 409
16.1 The Research Context 409
16.2 The Goodness-of-Fit Chi-Square Test 410
16.3 The Chi-Square Sampling Distribution 416
16.4 The Chi-Square Test for Independence 418
16.5 The Chi-Square Test for a 2 × 2 Contingency Table 422
16.6 A Measure of Effect Size for Chi-Square Tests 423
16.7 Major Contributors to a Significant Chi-Square 424
16.8 Using the Chi-Square Test with Quantitative Variables 425
16.9 The Assumptions 426
16.10 Formal Presentation of Findings 426
16.11 Other Nonparametric Tests 426
Summary 429
Microsoft® Excel and SPSS® 430
Exercises 431
Work Problems 432
Part 5 Review Bivariate Data and Chi-Square Tests 437
Appendix A Statistical Tables 433
Appendix B Answers to Exercises and Work Problems 461
Appendix c Instructions for Microsoft® Excel and SPSS® 533
References 565
Glossary 573
List of Selected Formulas 583
List of Symbols 589
Index 593
| Erscheinungsdatum | 25.10.2024 |
|---|---|
| Verlagsort | New York |
| Sprache | englisch |
| Maße | 160 x 234 mm |
| Gewicht | 816 g |
| Themenwelt | Mathematik / Informatik ► Mathematik ► Statistik |
| Sozialwissenschaften ► Soziologie ► Empirische Sozialforschung | |
| ISBN-10 | 1-394-18410-7 / 1394184107 |
| ISBN-13 | 978-1-394-18410-1 / 9781394184101 |
| Zustand | Neuware |
| Haben Sie eine Frage zum Produkt? |
aus dem Bereich


