Statistics
Pearson (Verlag)
978-0-13-008369-2 (ISBN)
- Titel erscheint in neuer Auflage
- Artikel merken
For algebra-based Introductory Statistics Courses.
The overarching goal of this text is to empower students to be statistical thinkers
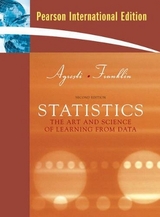
Alan Agresti and Chris Franklin have merged their research expertise, as well as their extensive real-world and teaching experience, to develop a new introductory statistics text that makes students statistically literate, while encouraging them to ask and answer interesting statistical questions. The authors have successfully crafted a text that takes the ideas that have turned statistics into a central science in modern life and makes them accessible and engaging to students without compromising necessary rigor.
The varied and data-rich examples and exercises place heavy emphasis on thinking about and understanding statistical concepts. The applications are topical and current and successfully illustrate the relevance of statistics.
The authors understand that most of the real-world data that students encounter outside the class room are categorical data. Unlike many texts at this level, Agresti/Franklin incorporates categorical data where appropriate and draws distinctions between theory and practical application of statistical ideas and methods.
The text was written, from the ground up, to embrace and support the 6 recommendations of the ASA endorsed GAISE (Guidelines for Assessment for Instruction in Statistical Education) Report - http://www.amstat.org/education/gaise/GAISECollege.htm:
Emphasize statistical literacy and develop statistical thinking.
Use real data.
Stress conceptual understanding rather than mere knowledge of procedures.
Foster active learning in the classroom.
Use technology for developing concepts and analyzing data.
Use assessment to evaluate and improve student learning.
Comes with a CD containing data sets, additional activities, and applets. The CD with the IE, furthermore, includes Instructor-to-Instructor videos which further detail, by chapter, the authors approach and provides suggestions on how to present concepts. These Instructor-to-Instructor videos are very complimentary to the IE chapter introductions.
Alan Agresti is Distinguished Professor in the Department of Statistics at the University of Florida. He has been teaching statistics there for 30 years, including the development of three courses in statistical methods for social science students and three courses in categorical data analysis. He is author of over 100 refereed article and four texts including "Statistical Methods for the Social Sciences" (with Barbara Finlay, Prentice Hall, 3rd edition 1997) and "Categorical Data Analysis" (Wiley, 2nd edition 2002). He is a Fellow of the American Statistical Association and recipient of an Honorary Doctor of Science from De Montfort University in the UK. In 2003 he was named "Statistician of the Year" by the Chicago chapter of the American Statistical Association and in 2004 he was the first honoree of the Herman Callaert Leadership Award in Biostatistical Education and Dissemination awarded by the University of Limburgs, Belgium. He has held visiting positions at Harvard University, Boston University, London School of Economics, and Imperial College and has taught courses or short courses for universities and companies in about 20 countries worldwide. He has also received teaching awards from UF and an excellence in writing award from John Wiley & Sons. Christine Franklin is a Lecturer and Honors Professor in the Department of Statistics at the University of Georgia. She is beginning her 16th year at UGA, her 25th year as college faculty in statistics. Chris has been actively involved at the national level with promoting statistical education at the K-12 level and college undergraduate level since the 1980's. Her involvement with the AP Statistics program includes preparing teachers to teach AP Statistics and serving as a table leader at the AP Statistics readings since 1997. She also conducts College Board workshops and in 1998, began teaching a new course at UGA that she designed for secondary math teachers. Her most recent course development has been a new master's level course in probability and statistics for K-8 teachers. Much of the development of these courses was based on her involvement serving as a statistical advisor for the 2000 NCTM Principles and Standards of Mathematics. She is also the undergraduate coordinator in the Statistics department at UGA and is presently working to restructure the undergraduate statistics major. Chris has found her most challenging educational role to be serving as Chairperson of her local school district's Board of Education. This has also been a very rewarding experience, especially working with teachers in her system and with the curriculum and instruction. Most important for Chris is her family. Her husband, Dale Green, is a physician. They have two boys, Corey (a junior in high school and taking AP Statistics this year) and Cody (a fourth grader). Her most recent memorable experience was backpacking for 11 days in Philmont, NM with her older son and the boy scouts.
Agresti/ Franklin: Statistics
TABLE OF CONTENTS
Note: each chapter concludes with Answers to Chapter Figure Questions; Chapter Summary; Summary of notation; Chapter Exercises.
1. Statistics: The Art and Science of Learning from Data
1.1 How Can You Investigate Using Data?
1.2 We Learn about Populations Using Samples
1.3 What Role do Computers Play in Statistics?
2. Exploring Data with Graphs and Numerical Summaries
2.1What Are the Types of Data?
2.2 How Can We Describe Data Using Graphical Summaries?
2.3 How Can We Describe the Center of Quantitative Data?
2.4 How Can We Describe the Spread of Quantitative Data?
2.5 How Can Measures of Position Describe Spread?
2.6 How Are Descriptive Summaries Misused?
3. Association: Contingency, Correlation, and Regression
3.1 How Can We Explore the Association between Two Categorical Variables?
3.2 How Can We Explore the Association between Two Quantitative Variables?
3.3 How Can We Predict the Outcome of a Variable
3.4 What are Some Cautions in Analyzing Associations?
4. Gathering Data
4.1 Should We Experiment or Should We Merely Observe?
4.2 What Are Good Ways and Poor Waysto Sample?
4.3 What Are Good Ways and Poor Waysto Experiment?
4.4 What Are Other Ways to Perform Experimental and Observational Studies?
5. Probability in our Daily Lives
5.1 How Can Probability Quantify Randomness?
5.2 How Can We Find Probabilities?
5.3 Conditional Probability: What’s the Probability of A, Given B?
5.4 Applying the Probability Rules
6. Probability Distributions
6.1 How Can We Summarize Possible Outcomes and their Probabilities?
6.2 How Can We Find Probabilities for Bell-Shaped Distributions?
6.3 How Can We Find Probabilities when Each Observation Has Two Possible
6.4 How Likely Are the Possible Values of a Statistic?: The Sampling Distribution
6.5 How Close Are Sample Means to Population Means
6.6 How Can We Make Inferences about a Population?
7. Statistical Inference: Confidence Intervals
7.1 What Are Point and Interval Estimates of Population Parameters?
7.2 How Can We Construct a Confidence Interval to Estimate a Population Proportion?
7.3 How Can We Construct a Confidence Interval to Estimate a Population Mean?
7.4 How Do We Choose the Sample Size for a Study
7.5 How Do Computers Make New Estimation Methods Possible?
8. Statistical Inference: Significance Tests about Hypotheses
8.1 What Are the Steps for Performing a Significance Test?
8.2 Significance Tests about Proportions
8.3 Significance Tests about Means
8.4 Decisions and Types of Errors in Significance Tests
8.5 Limitations of Significance Tests
8.6 How Likely Is Type II Error (Not Rejecting H0, Even though it’s False)?
9. Comparing Two Groups
9.1 Categorical Response: How Can We Compare Two Proportions?
9.2 Quantitative Response: How Can We Compare Two Means?
9.3 Other Ways of Comparing Means and Comparing Proportions
9.4 How Can We Analyze Dependent Samples?
9.5 How Can We Adjust for Effects of Other Variables?
10. Analyzing the Association Between Categorical Variables
10.1 What Is Independenceand What Is Association?
10.2 How Can We Test whether Categorical Variables are Independent?
10.3 How Strong is the Association?
10.4 How Can Residuals Reveal the Pattern of Association?
10.5 What if the Sample Size is Small? Fisher’s Exact Test
11. Analyzing Association between Quantitative Variables: Regression Analysis
11.1 How Can We “Model” How Two Variables Are Related?
11.2 How Can We Describe Strength of Association?
11.3 How Can We Make Inferences about the Association?
11.4 What Do We Learn from How the Data Vary around the Regression Line?
11.5 Exponential Regression: A Model for Nonlinearity
12. Multiple Regression
12.1 How Can We Use Several Variables to Predict a Response?
12.2 Extending the Correlation and R-squared for Multiple Regression
12.3 How Can We Use Multiple Regression to Make Inferences?
12.4 Checking a Regression Model Using Residual Plots
12.5 How Can Regression Include Categorical Predictors?
12.6 How Can We Model a Categorical Response?
13. Comparing Groups: Analysis of Variance Methods
13.1 How Can We Compare Several Means?: One-Way ANOVA
13.2 How Should We Follow Up an ANOVA F test
13.3 What if there Are Two Factors?: Two-way ANOVA
14. Nonparametric Statistics
14.1 How Can We Compare Two Groups by Ranking?
14.2 Nonparametric Methods for Several Groups and for Matched Pairs
Appendices
Appendix A: Tables
Appendix B: Selected Answers
Index
Photo Credits
| Erscheint lt. Verlag | 16.2.2006 |
|---|---|
| Sprache | englisch |
| Maße | 222 x 281 mm |
| Gewicht | 1750 g |
| Themenwelt | Mathematik / Informatik ► Mathematik ► Statistik |
| ISBN-10 | 0-13-008369-0 / 0130083690 |
| ISBN-13 | 978-0-13-008369-2 / 9780130083692 |
| Zustand | Neuware |
| Haben Sie eine Frage zum Produkt? |
aus dem Bereich
