Statistics
Pearson (Verlag)
978-0-13-408021-5 (ISBN)
- Titel erscheint in neuer Auflage
- Artikel merken
A Contemporary Classic
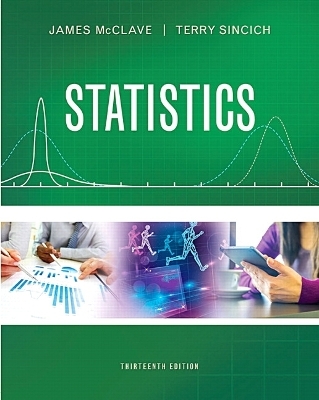
Classic, yet contemporary; theoretical, yet applied–McClave & Sincich’s Statistics gives you the best of both worlds. This text offers a trusted, comprehensive introduction to statistics that emphasizes inference and integrates real data throughout. The authors stress the development of statistical thinking, the assessment of credibility, and value of the inferences made from data. This new edition is extensively revised with an eye on clearer, more concise language throughout the text and in the exercises.
Ideal for one- or two-semester courses in introductory statistics, this text assumes a mathematical background of basic algebra. Flexibility is built in for instructors who teach a more advanced course, with optional footnotes about calculus and the underlying theory.
Also available with MyStatLab
MyStatLab™ is an online homework, tutorial, and assessment program designed to work with this text to engage students and improve results. Within its structured environment, students practice what they learn, test their understanding, and pursue a personalized study plan that helps them absorb course material and understand difficult concepts. For this edition, MyStatLab offers 25% new and updated exercises.
Note: You are purchasing a standalone product; MyLab™ & Mastering™ does not come packaged with this content. Students, if interested in purchasing this title with MyLab & Mastering, ask your instructor for the correct package ISBN and Course ID. Instructors, contact your Pearson representative for more information.
If you would like to purchase both the physical text and MyLab & Mastering, search for:
0134090438 / 9780134090436 * Statistics Plus New MyStatLab with Pearson eText -- Access Card Package Package consists of:
0134080211 / 9780134080215 * Statistics
0321847997 / 9780321847997 * My StatLab Glue-in Access Card
032184839X / 9780321848390 * MyStatLab Inside Sticker for Glue-In Packages
Dr. Jim McClave is currently President and CEO of Info Tech, Inc., a statistical consulting and software development firm with an international clientele. He is also currently an Adjunct Professor of Statistics at the University of Florida, where he was a full-time member of the faculty for twenty years. Dr. Terry Sincich obtained his PhD in Statistics from the University of Florida in 1980. He is an Associate Professor in the Information Systems & Decision Sciences Department at the University of South Florida in Tampa. Dr. Sincich is responsible for teaching basic statistics to all undergraduates, as well as advanced statistics to all doctoral candidates, in the College of Business Administration. He has published articles in such journals as the Journal of the American Statistical Association, International Journal of Forecasting, Academy of Management Journal, and Auditing: A Journal of Practice & Theory. Dr. Sincich is a co-author of the texts Statistics, Statistics for Business & Economics, Statistics for Engineering & the Sciences, and A Second Course in Statistics: Regression Analysis.
1. Statistics, Data, and Statistical Thinking
1.1 The Science of Statistics
1.2 Types of Statistical Applications
1.3 Fundamental Elements of Statistics
1.4 Types of Data
1.5 Collecting Data: Sampling and Related Issues
1.6 The Role of Statistics in Critical Thinking and Ethics
Statistics in Action: Social Media Network Usage—Are You Linked In?
Using Technology: MINITAB: Accessing and Listing Data
2. Methods for Describing Sets of Data
2.1 Describing Qualitative Data
2.2 Graphical Methods for Describing Quantitative Data
2.3 Numerical Measures of Central Tendency
2.4 Numerical Measures of Variability
2.5 Using the Mean and Standard Deviation to Describe Data
2.6 Numerical Measures of Relative Standing
2.7 Methods for Detecting Outliers: Box Plots and z-Scores
2.8 Graphing Bivariate Relationships (Optional)
2.9 Distorting the Truth with Descriptive Statistics
Statistics in Action: Body Image Dissatisfaction: Real or Imagined?
Using Technology: MINITAB: Describing Data
TI-83/TI–84 Plus Graphing Calculator: Describing Data
3. Probability
3.1 Events, Sample Spaces, and Probability
3.2 Unions and Intersections
3.3 Complementary Events
3.4 The Additive Rule and Mutually Exclusive Events
3.5 Conditional Probability
3.6 The Multiplicative Rule and Independent Events
3.7 Some Additional Counting Rules (Optional)
3.8 Bayes’s Rule (Optional)
Statistics in Action: Lotto Buster! Can You Improve Your Chance of Winning?
Using Technology: TI-83/TI-84 Plus Graphing Calculator: Combinations and Permutations
4. Discrete Random Variables
4.1 Two Types of Random Variables
4.2 Probability Distributions for Discrete Random Variables
4.3 Expected Values of Discrete Random Variables
4.4 The Binomial Random Variable
4.5 The Poisson Random Variable (Optional)
4.6 The Hypergeometric Random Variable (Optional)
Statistics in Action: Probability in a Reverse Cocaine Sting: Was Cocaine Really Sold?
Using Technology: MINITAB: Discrete Probabilities
TI-83/TI-84 Plus Graphing Calculator: Discrete Random Variables and Probabilities
5. Continuous Random Variables
5.1 Continuous Probability Distributions
5.2 The Uniform Distribution
5.3 The Normal Distribution
5.4 Descriptive Methods for Assessing Normality
5.5 Approximating a Binomial Distribution with a Normal Distribution (Optional)
5.6 The Exponential Distribution (Optional)
Statistics in Action: Super Weapons Development—Is the Hit Ratio Optimized?
Using Technology: MINITAB: Continuous Random Variable Probabilities and Normal Probability Plots
TI-83/TI-84 Plus Graphing Calculator: Normal Random Variable and Normal Probability Plots
6. Sampling Distributions
6.1 The Concept of a Sampling Distribution
6.2 Properties of Sampling Distributions: Unbiasedness and Minimum Variance
6.3 The Sampling Distribution of (x-bar) and the Central Limit Theorem
6.4 The Sampling Distribution of the Sample Proportion
Statistics in Action: The Insomnia Pill: Is It Effective?
Using Technology: MINITAB: Simulating a Sampling Distribution
7. Inferences Based on a Single Sample: Estimation with Confidence Intervals
7.1 Identifying and Estimating the Target Parameter
7.2 Confidence Interval for a Population Mean: Normal (z) Statistic
7.3 Confidence Interval for a Population Mean: Student’s t-Statistic
7.4 Large-Sample Confidence Interval for a Population Proportion
7.5 Determining the Sample Size
7.6 Confidence Interval for a Population Variance (Optional)
Statistics in Action: Medicare Fraud Investigations
Using Technology: MINITAB: Confidence Intervals
TI-83/TI-84 Plus Graphing Calculator: Confidence Intervals
8. Inferences Based on a Single
Sample: Tests of Hypothesis
8.1 The Elements of a Test of Hypothesis
8.2 Formulating Hypotheses and Setting Up the Rejection Region
8.3 Observed Significance Levels: p-Values
8.4 Test of Hypothesis about a Population Mean: Normal (z) Statistic
8.5 Test of Hypothesis about a Population Mean: Student’s t-Statistic
8.6 Large-Sample Test of Hypothesis about a Population Proportion
8.7 Calculating Type II Error Probabilities: More about β (Optional)
8.8 Test of Hypothesis about a Population Variance (Optional)
Statistics in Action: Diary of a KLEENEX® User—How Many Tissues in a Box?
Using Technology: MINITAB: Tests of Hypotheses
TI-83/TI-84 Plus Graphing Calculator: Tests of Hypotheses
9. Inferences Based on Two Samples: Confidence Intervals and Tests of Hypotheses
9.1 Identifying the Target Parameter
9.2 Comparing Two Population Means: Independent Sampling
9.3 Comparing Two Population Means: Paired Difference Experiments
9.4 Comparing Two Population Proportions: Independent Sampling
9.5 Determining the Sample Size
9.6 Comparing Two Population Variances: Independent Sampling (Optional)
Statistics in Action: ZixIt Corp. v. Visa USA Inc.—A Libel Case
Using Technology: MINITAB: Two-Sample Inferences
TI-83/TI-84 Plus Graphing Calculator: Two Sample Inferences
10. Analysis of Variance: Comparing More than Two Means
10.1 Elements of a Designed Study
10.2 The Completely Randomized Design: Single Factor
10.3 Multiple Comparisons of Means
10.4 The Randomized Block Design
10.5 Factorial Experiments: Two Factors
Statistics in Action: Voice versus Face Recognition—Does One Follow the Other?
Using Technology: MINITAB: Analysis of Variance
TI-83/TI-84 Plus Graphing Calculator: Analysis of Variance
11. Simple Linear Regression
11.1 Probabilistic Models
11.2 Fitting the Model: The Least Squares Approach
11.3 Model Assumptions
11.4 Assessing the Utility of the Model: Making Inferences about the Slope β1
11.5 The Coefficients of Correlation and Determination
11.6 Using the Model for Estimation and Prediction
11.7 A Complete Example
Statistics in Action: Can “Dowsers” Really Detect Water?
Using Technology: MINITAB: Simple Linear Regression
TI-83/TI-84 Plus Graphing Calculator: Simple Linear Regression
12. Multiple Regression and Model Building
12.1 Multiple-Regression Models
PART I: First-Order Models with Quantitative Independent Variables
12.2 Estimating and Making Inferences about the β Parameters
12.3 Evaluating Overall Model Utility
12.4 Using the Model for Estimation and Prediction
PART II: Model Building in Multiple Regression
12.5 Interaction Models
12.6 Quadratic and Other Higher Order Models
12.7 Qualitative (Dummy) Variable Models
12.8 Models with Both Quantitative and Qualitative Variables (Optional)
12.9 Comparing Nested Models (Optional)
12.10 Stepwise Regression (Optional)
PART III: Multiple Regression Diagnostics
12.11 Residual Analysis: Checking the Regression Assumptions
12.12 Some Pitfalls: Estimability, Multicollinearity, and Extrapolation
Statistics in Action: Modeling Condominium Sales: What Factors Affect
Auction Price? Using Technology: MINITAB: Multiple Regression TI-83/TI-84 Plus Graphing Calculator: Multiple Regression
13. Categorical Data Analysis
13.1 Categorical Data and the Multinomial Experiment
13.2 Testing Categorical Probabilities: One-Way Table
13.3 Testing Categorical Probabilities: Two-Way (Contingency) Table
13.4 A Word of Caution about Chi-Square Tests
Statistics in Action: The Case of the Ghoulish Transplant Tissue Using Technology: MINITAB: Chi-Square Analyses TI-83/TI-84 Plus Graphing Calculator: Chi-Square Analyses
14. Nonparametric Statistics (available online)
14.1 Introduction: Distribution-Free Tests
14.2 Single-Population Inferences
14.3 Comparing Two Populations: Independent Samples
14.4 Comparing Two Populations: Paired Difference Experiment
14.5 Comparing Three or More Populations: Completely Randomized Design
14.6 Comparing Three or More Populations: Randomized Block Design
14.7 Rank Correlation 14-48
Statistics in Action: Pollutants at a Housing Development: A Case of Mishandling Small Samples 14-2
Using Technology: MINITAB: Nonparametric Tests 14-65
| Erscheinungsdatum | 06.08.2016 |
|---|---|
| Sprache | englisch |
| Maße | 221 x 279 mm |
| Gewicht | 1882 g |
| Themenwelt | Mathematik / Informatik ► Mathematik ► Statistik |
| ISBN-10 | 0-13-408021-1 / 0134080211 |
| ISBN-13 | 978-0-13-408021-5 / 9780134080215 |
| Zustand | Neuware |
| Haben Sie eine Frage zum Produkt? |
aus dem Bereich


