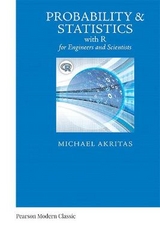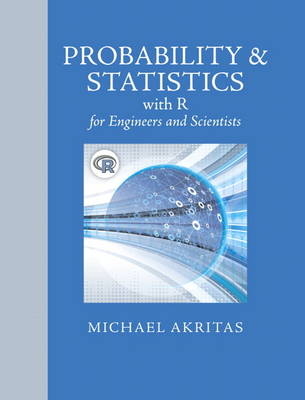
Probability & Statistics with R for Engineers and Scientists
Pearson (Verlag)
978-0-321-85299-1 (ISBN)
- Titel ist leider vergriffen;
keine Neuauflage - Artikel merken
Michael G. Akritas has been teaching Statistics at Penn State University since 1985. He is the author of approximately 100 research publications dealing with a wide range of statistical topics. He has supervised 18 Ph.D. and 12 M.Sc. students and is currently supervising three Ph.D. students. He is co-Founder of the International Society for Nonparametric Statistics, former Director of the National Statistical Consulting Center for Astronomy and co-Editor of the Journal of Nonparametric Statistics. He held a three year affiliation with the National Technical University of Athens, and visiting appointments at MIT, Texas A&M University, University of Pennsylvania, University of Göttingen, University of Cyprus, Australian National University, and UNICAMP. He has been an elected Fellow of the Institute of Mathematical Statistics and of the American Statistical Association since 2001.
1. Basic Statistical Concepts
1.1 Why Statistics?
1.2 Populations and Samples
1.2.1 Exercises
1.3 Some Sampling Concepts
1.3.1 Representative Samples
1.3.2 Simple Random Sampling, and Stratied Sampling
1.3.3 Sampling With and Without Replacement
1.3.4 Non-representative Sampling
1.3.5 Exercises
1.4 Random Variables and Statistical Populations
1.4.1 Exercises
1.5 Basic Graphics for Data Visualization
1.5.1 Histograms and Stem and Leaf Plots
1.5.2 Scatterplots
1.5.3 Pie Charts and Bar Graphs
1.5.4 Exercises
1.6 Proportions, Averages and Variances
1.6.1 Population Proportion and Sample Proportion
1.6.2 Population Average and Sample Average
1.6.3 Population Variance and Sample Variance
1.6.4 Exercises
1.7 Medians, Percentiles and Box Plots
1.7.1 Exercises
1.8 Comparative Studies
1.8.1 Basic Concepts and Comparative Graphics
1.8.2 Lurking Variables and Simpson’s Paradox
1.8.3 Causation: Experiments and Observational Studies
1.8.4 Factorial Experiments: Main Eects and Interactions
1.8.5 Exercises
1.9 The Role of Probability
1.10 Approaches to Statistical Inference
2. Introduction to Probability
2.1 Overview
2.2 Sample Spaces, Events and Set Operations
2.2.1 Exercises
2.3 Experiments with Equally Likely Outcomes
2.3.1 Denition and Interpretation of Probability
2.3.2 Counting Techniques
2.3.3 Probability Mass Functions and Simulations
2.3.4 Exercises
2.4 Axioms and Properties of Probabilities
2.4.1 Exercises
2.5 Conditional Probability
2.5.1 The Multiplication Rule and Tree Diagrams
2.5.2 Law of Total Probability and Bayes Theorem
2.5.3 Exercises
2.6 Independent Events
2.6.1 Applications to System Reliability
2.6.2 Exercises
3. Random Variables and Their Distributions
3.1 Introduction.
3.2 Describing a Probability Distribution.
3.2.1 Random Variables, Revisited
3.2.2 The Cumulative Distribution Function
3.2.3 The Density Function of a Continuous Distribution
3.2.4 Exercises
3.3 Parameters of Probability Distributions
3.3.1 Expected Value
3.3.2 Variance and Standard Deviation
3.3.3 Population Percentiles
3.3.4 Exercises
3.4 Models for Discrete Random Variables
3.4.1 The Bernoulli and Binomial Distributions
3.4.2 The Hypergeometric Distribution.
3.4.3 The Geometric and Negative Binomial Distributions
3.4.4 The Poisson Distribution
3.4.5 Exercises
3.5 Models for Continuous Random Variables
3.5.1 The Exponential Distribution
3.5.2 The Normal Distribution
3.5.3 The Q-Q Plot
3.5.4 Exercises
4. Jointly Distributed Random Variables
4.1 Introduction.
4.2 Describing Joint Probability Distributions
4.2.1 The Joint and Marginal PMF
4.2.2 The Joint and Marginal PDF
4.2.3 Exercises
4.3 Conditional Distributions
4.3.1 Conditional Probability Mass Functions
4.3.2 Conditional Probability Density Functions
4.3.3 The Regression Function
4.3.4 Independence
4.3.5 Exercises
4.4 Mean Value of Functions of Random Variables
4.4.1 The Basic Result
4.4.2 Expected Value of Sums
4.4.3 The Covariance and the Variance of Sums
4.4.4 Exercises
4.5 Quantifying Dependence
4.5.1 Positive and Negative Dependence
4.5.2 Pearson’s (or Linear) Correlation Coefficient
4.5.3 Exercises
4.6 Models for Joint Distributions.
4.6.1 Hierarchical Models
4.6.2 Regression Models
4.6.3 The Bivariate Normal Distribution
4.6.4 The Multinomial Distribution
4.6.5 Exercises
5. Some Approximation Results
5.1 Introduction
5.2 The LLN and the Consistency of Averages
5.2.1 Exercises
5.3 Convolutions
5.3.1 What They Are and How They Are Used
5.3.2 The Distribution of[X bar]in The Normal Case
5.3.3 Exercises
5.4 The Central Limit Theorem
5.4.1 The DeMoivre-Laplace Theorem
5.4.2 Exercises
6. Fitting Models to Data
6.1 Introduction.
6.2 Some Estimation Concepts
6.2.1 Unbiased Estimation
6.2.2 Model-Freevs Model-Based Estimation
6.2.3 Exercises
6.3 Methods for Fitting Models to Data
6.3.1 The Method of Moments
6.3.2 The Method of Maximum Likelihood
6.3.3 The Method of Least Squares
6.3.4 Exercises
6.4 Comparing Estimators: The MSE Criterion
6.4.1 Exercises
7. Condence and Prediction Intervals
7.1 Introduction to Condence Intervals
7.1.1 Construction of Condence Intervals
7.1.2 Z Condence Intervals
7.1.3 The T Distribution and T Condence Intervals
7.1.4 Outline of the Chapter
7.2 CI Semantics: The Meaning of “Condence”
7.3 Types of Condence Intervals
7.3.1 T CIs for the Mean.
7.3.2 Z CIs for Proportions
7.3.3 T CIs for the Regression Parameters
7.3.4 The Sign CI for the Median
7.3.5 Chi-Square CIs for the Normal Variance and Standard Deviation
7.3.6 Exercises
7.4 The Issue of Precision
7.4.1 Exercises
7.5 Prediction Intervals
7.5.1 Basic Concepts
7.5.2 Prediction of a Normal Random Variable
7.5.3 Prediction in Normal Simple Linear Regression
7.5.4 Exercises
8. Testing of Hypotheses
8.1 Introduction.
8.2 Setting up a Test Procedure
8.2.1 The Null and Alternative Hypotheses
8.2.2 Test Statistics and Rejection Rules
8.2.3 Z Tests and T Tests
8.2.4 P -Values
8.2.5 Exercises
8.3 Types of Tests
8.3.1 T Tests for the Mean
8.3.2 Z Tests for Proportions
8.3.3 T Tests about the Regression Parameters
8.3.4 The ANOVA F Test in Regression
8.3.5 The Sign Test for the Median
8.3.6 Chi-SquareTests for a Normal Variance
8.3.7 Exercises
8.4 Precision in Hypothesis Testing
8.4.1 Type I and Type II Errors
8.4.2 Power and Sample Size Calculations
8.4.3 Exercises
9. Comparing Two Populations
9.1 Introduction.
9.2 Two-Sample Tests and CIs for Means
9.2.1 Some Basic Results
9.2.2 Condence Intervals
9.2.3 Hypothesis Testing
9.2.4 Exercises
9.3 The Rank-Sum Test Procedure
9.3.1 Exercises
9.4 Comparing Two Variances
9.4.1 Levene’s Test
9.4.2 The F Test under Normality
9.4.3 Exercises
9.5 Paired Data
9.5.1 Denition and Examples of Paired Data
9.5.2 The Paired Data T Test
9.5.3 The Paired T Test for Proportions
9.5.4 The Wilcox on Signed-Rank Test
9.5.5 Exercises
10. Comparing k(> 2) Populations
10.1 Introduction
10.2 Types of k-Sample Tests
10.2.1 The ANOVA F Test for Means
10.2.2 The Kruskal-Wallis Test
10.2.3 The Chi-Square Test for Proportions
10.2.4 Exercises
10.3 Simultaneous CIs and Multiple Comparisons
10.3.1 Bonferroni Multiple Comparisons and Simultaneous CIs
10.3.2 Tukey’s Multiple Comparisons and Simultaneous CIs
10.3.3 Tukey’s Multiple Comparisons on the Ranks
10.3.4 Exercises
10.4 Randomized Block Designs
10.4.1 The Statistical Model and Hypothesis
10.4.2 The ANOVA F Test
10.4.3 Friedman’s Test and F Test on the Ranks
10.4.4 Multiple Comparisons
10.4.5 Exercises
11. Multifactor Experiments
11.1 Introduction.
11.2 Two-Factor Designs
11.2.1 F Tests for Main Effects and Interactions
11.2.2 Testing the Validity of Assumptions
11.2.3 One Observation per Cell
11.2.4 Exercises
11.3 Three-Factor Designs
11.3.1 Exercises
11.4 2r Factorial Experiments
11.4.1 Blocking and Confounding
11.4.2 Fractional Factorial Designs
11.4.3 Exercises
12. Polynomial and Multiple Regression
12.1 Introduction.
12.2 The Multiple Linear Regression Model
12.2.1 Exercises
12.3 Estimation Testing and Prediction
12.3.1 The Least Squares Estimators
12.3.2 Model Utility Test
12.3.3 Testing the Significance of Regression Coefficients
12.3.4 Condence Intervals and Prediction
12.3.5 Exercises
12.4 Additional Topics
12.4.1 Weighted Least Squares
12.4.2 Applications to Factorial Designs
12.4.3 Variable Selection
12.4.4 Inuential Observations
12.4.5 Multicolinearity
12.4.6 Logistic Regression
12.4.7 Exercises
13. Statistical Process Control
13.1 Introduction and Overview
13.2 The [X bar] Chart
13.2.1 [X bar] Chart with Known Target Values
13.2.2 [X bar] Chart with Estimated Target Values
13.2.3 The [X bar] Chart
13.2.4 Average Run Length, and Supplemental Rules
13.2.5 Exercises
13.3 The S and R Charts
13.3.1 Exercises
13.4 The p and c Charts
13.4.1 The p Chart
13.4.2 The c Chart
13.4.3 Exercises
13.5 CUSUM and EWMA Charts
13.5.1 The CUSUM Chart
13.5.2 The EWMA Chart
13.5.3 Exercises
A. Tables
B. Answers To Selected Exercises
| Erscheint lt. Verlag | 13.1.2015 |
|---|---|
| Sprache | englisch |
| Maße | 210 x 260 mm |
| Gewicht | 1160 g |
| Themenwelt | Mathematik / Informatik ► Mathematik ► Statistik |
| Mathematik / Informatik ► Mathematik ► Wahrscheinlichkeit / Kombinatorik | |
| ISBN-10 | 0-321-85299-0 / 0321852990 |
| ISBN-13 | 978-0-321-85299-1 / 9780321852991 |
| Zustand | Neuware |
| Haben Sie eine Frage zum Produkt? |
aus dem Bereich
