Graphics for Statistics and Data Analysis with R
Chapman & Hall/CRC (Verlag)
978-1-58488-087-5 (ISBN)
- Titel erscheint in neuer Auflage
- Artikel merken
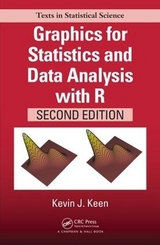
Graphics for Statistics and Data Analysis with R presents the basic principles of sound graphical design and applies these principles to engaging examples using the graphical functions available in R. It offers a wide array of graphical displays for the presentation of data, including modern tools for data visualization and representation.
The book considers graphical displays of a single discrete variable, a single continuous variable, and then two or more of each of these. It includes displays and the R code for producing the displays for the dot chart, bar chart, pictographs, stemplot, boxplot, and variations on the quantile-quantile plot. The author discusses nonparametric and parametric density estimation, diagnostic plots for the simple linear regression model, polynomial regression, and locally weighted polynomial regression for producing a smooth curve through data on a scatterplot. The last chapter illustrates visualizing multivariate data with examples using Trellis graphics.
Showing how to use graphics to display or summarize data, this text provides best practice guidelines for producing and choosing among graphical displays. It also covers the most effective graphing functions in R. R code is available for download on the book’s website.
Kevin J. Keen is a statistician and an associate professor of mathematics at the University of Northern British Columbia in Prince George, Canada.
INTRODUCTION
The Graphical Display of Information
Introduction
Know the Intended Audience
Principles of Effective Statistical Graphs
Graphicacy
Graphical Statistics
A SINGLE DISCRETE VARIABLE
Basic Charts for the Distribution of a Single Discrete Variable
Introduction
An Example from the United Nations
The Dot Chart
The Bar Chart
The Pie Chart
Advanced Charts for the Distribution of a Single Discrete Variable
Introduction
The Stacked Bar Chart
The Pictograph
Variations on the Dot and Bar Charts
Frames, Grid Lines, and Order
A SINGLE CONTINUOUS VARIABLE
Exploratory Plots for the Distribution of a Single Continuous Variable
Introduction
The Dotplot
The Stemplot
The Boxplot
The EDF Plot
Diagnostic Plots for the Distribution of a Continuous Variable
Introduction
The Quantile-Quantile Plot
The Probability Plot
Estimation of Quartiles and Percentiles
Nonparametric Density Estimation for a Single Continuous Variable
Introduction
The Histogram
Kernel Density Estimation
Spline Density Estimation
Choosing a Plot for a Continuous Variable
Parametric Density Estimation for a Single Continuous Variable
Introduction
Normal Density Estimation
Transformations to Normality
Pearson’s Curves
Gram–Charlier Series Expansion
TWO VARIABLES
Depicting the Distribution of Two Discrete Variables
Introduction
The Grouped Dot Chart
The Grouped Dot-Whisker Chart
The Two-Way Dot Chart
The Multi-Valued Dot Chart
The Side-by-Side Bar Chart
The Side-by-Side Bar-Whisker Chart
The Side-by-Side Stacked Bar Chart
The Side-by-Side Pie Chart
The Mosaic Chart
Depicting the Distribution of One Continuous Variable and One Discrete Variable
Introduction
The Side-by-Side Dotplot
The Side-by-Side Boxplot
The Notched Boxplot
The Variable-Width Boxplot
The Back-to-Back Stemplot
The Side-by-Side Stemplot
The Side-by-Side Dot-Whisker Plot
The Trellis Kernel Density Estimate
Depicting the Distribution of Two Continuous Variables
Introduction
The Scatterplot
The Sunflower Plot
The Bagplot
The Two-Dimensional Histogram
Two-Dimensional Kernel Density Estimation
STATISTICAL MODELS FOR TWO OR MORE VARIABLES
Graphical Displays for Simple Linear Regression
Introduction
The Simple Linear Regression Model
Residual Analysis
Influence Analysis
Graphical Displays for Polynomial Regression
Introduction
The Polynomial Regression Model
Splines
Locally Weighted Polynomial Regression
Visualizing Multivariate Data
Introduction
Three or More Discrete Variables
One Discrete and Two or More Continuous Variables
Observations of Multiple Variables
The Multiple Linear Regression Model
References
Index
Exercises appear at the end of each chapter.
| Erscheint lt. Verlag | 5.5.2010 |
|---|---|
| Reihe/Serie | Chapman & Hall/CRC Texts in Statistical Science |
| Zusatzinfo | 8 page color insert with 16 images; 500+; 36 Tables, black and white; 200 Illustrations, black and white |
| Sprache | englisch |
| Maße | 156 x 235 mm |
| Gewicht | 816 g |
| Themenwelt | Mathematik / Informatik ► Mathematik ► Statistik |
| ISBN-10 | 1-58488-087-2 / 1584880872 |
| ISBN-13 | 978-1-58488-087-5 / 9781584880875 |
| Zustand | Neuware |
| Haben Sie eine Frage zum Produkt? |
aus dem Bereich
