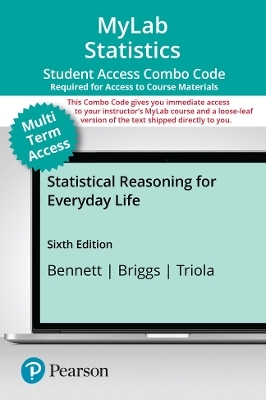
MyLab Math with Pearson eText (up to 24 months) + Print Combo Access Code for Statistical Reasoning for Everyday Life
Pearson (Hersteller)
978-0-13-810987-5 (ISBN)
- Titel nicht im Sortiment
- Artikel merken
Personalize learning with MyLab Statistics with Pearson+ eTextbook This flexible digital platform combines unrivaled content, online assessments and customizable features to personalize learning and improve results.
Pearson+ eTextbook is an easy-to-use digital textbook available within MyLab® that lets you read, highlight and take notes, all in one place.
NOTE: This MyLab combo access pack includes a MyLab access code plus a loose-leaf print version (delivered by mail) to complement your MyLab experience. To register for and use MyLab, you will need either a course ID from your instructor or an invitation link that your instructor will send you directly.
Used books, rentals, and purchases made outside of Pearson If purchasing or renting from companies other than Pearson, the access codes for the MyLab platform may not be included, may be incorrect, or may be previously redeemed. Check with the seller before completing your purchase.
About our authors Jeffrey Bennett holds a BA in biophysics (University of California, San Diego) and an MS and a PhD in astrophysics (University of Colorado), and has focused his career on math and science education. Bennett served as the first director of the program "Quantitative Reasoning and Mathematical Skills" at the University of Colorado at Boulder, where he developed the groundbreaking curriculum that became the basis of the textbook Using & Understanding Mathematics: A Quantitative Reasoning Approach (currently in its 8th Edition), which he co-authored with William Briggs. He is also the lead author of best-selling college textbooks on astronomy and astrobiology, and of more than a dozen books for children and adults. All 6 of his children's books have been selected for NASA's Story Time From Space. Among his other projects, Dr. Bennett proposed and co-led the development of the Voyage Scale Model Solar System in Washington, DC; created the free Totality app to help people learn about total solar eclipses; wrote an online primer on global warming; and developed a free, online curriculum for middle-school Earth and Space Science. Learn more at Dr. Bennett's websites, Jeffrey Bennett: Astronomer, Teacher, & Writer, and Big Kid Science. William L. Briggs was on the mathematics faculty at Clarkson University for 6 years and at the University of Colorado at Denver for 23 years, where he taught both undergraduate and graduate courses, with a special interest in applied mathematics. During much of that time he designed and taught courses in quantitative reasoning. In addition to this book, he has co-authored textbooks on statistical reasoning and calculus, as well as monographs in computational mathematics. He is also author of How America Got Its Guns (University of New Mexico Press). Dr. Briggs is a University of Colorado President's Teaching Scholar and the recipient of a Fulbright Fellowship to Ireland; he holds a BA degree from the University of Colorado and an MS and a PhD from Harvard University. Mario F. Triola is a Professor Emeritus of Mathematics at Dutchess Community College, where he has taught statistics for over 30 years. Marty also is the author of Elementary Statistics, 14th Edition; Elementary Statistics Using Excel, 7th Edition; Essentials of Statistics, 7th Edition and Elementary Statistics Using the TI-83/84 Plus Calculator, 5th Edition. He is a coauthor of Biostatistics for the Biological and Health Sciences, 2nd Edition. Marty designed the original Statdisk statistical software, and he has written several manuals and workbooks for technology supporting statistics education. He has been a speaker at many conferences and colleges. Marty's consulting work includes the design of casino slot machines and fishing rods. He has worked with attorneys in determining probabilities in paternity lawsuits, analyzing data in medical malpractice lawsuits, identifying salary inequities based on gender, and analyzing disputed election results. He has also used statistical methods in analyzing medical school surveys, analyzing survey results for the New York City Transit Authority, and analyzing COVID-19 virus data for government officials. Marty has testified as an expert witness in the New York State Supreme Court. The Text and Academic Authors Association has awarded Marty a "Texty" for Excellence for his work on Elementary Statistics, which at this writing has been the #1 statistics book in the United States for the past 25 years.
How to Succeed in Your Statistics Course
Applications Index
1. Speaking of Statistics
1.1 What Is/Are Statistics?
1.2 Sampling
1.3 Types of Statistical Studies
1.4 Should You Believe a Statistical Study?
FOCUS ON PSYCHOLOGY: Are You Driving “Drunk” on Your Cell Phone?
FOCUS ON PUBLIC HEALTH: Is Your Lifestyle Healthy?
FOCUS ON THE COVID-19 PANDEMIC: Why Is Statistics Critical to Understanding the Pandemic?
2. Measurement in Statistics
2.1 Data Types and Levels of Measurement
2.2 Dealing with Errors
2.3 Uses of Percentages in Statistics
2.4 Index Numbers
USING TECHNOLOGY: Inflation Calculator
FOCUS ON POLITICS: Who Benefits Most from a Tax Cut?
FOCUS ON ECONOMICS: What is the “Chained” CPI, and Why Does It Matter?
FOCUS ON THE COVID-19 PANDEMIC: Was Remote Learning a Viable Substitute for In-Person Classes?
3. Visual Displays of Data
3.1 Frequency Tables
USING TECHNOLOGY: Frequency Tables
3.2 Picturing Distributions of Data
USING TECHNOLOGY: Bar Graphs
USING TECHNOLOGY: Pie Charts
USING TECHNOLOGY: Line Charts and Histograms
3.3 Graphics in the Media
USING TECHNOLOGY: Graphs with Multiple Data Sets
3.4 A Few Cautions about Graphics
FOCUS ON HISTORY: Can War Be Described with a Graph?
FOCUS ON THE ENVIRONMENT: How Much Is the Atmospheric Carbon Dioxide Concentration Changing?
4. Describing Data
4.1 What Is Average?
USING TECHNOLOGY: Mean, Median, and Mode
4.2 Shapes of Distributions
4.3 Measures of Variation
USING TECHNOLOGY: Quartiles
USING TECHNOLOGY: Boxplots
USING TECHNOLOGY: Standard Deviation
4.4 Statistical Paradoxes
FOCUS ON THE STOCK MARKET: What's Average about the Dow?
FOCUS ON ECONOMICS: Are the Rich Getting Richer?
5. A Normal World
5.1 What Is Normal?
5.2 Properties of the Normal Distribution
USING TECHNOLOGY: Standard Scores and Percentiles
5.3 The Central Limit Theorem
FOCUS ON EDUCATION: What Can We Learn from SAT Trends?
FOCUS ON PSYCHOLOGY: Are We Smarter Than Our Parents?
FOCUS ON CLIMATE CHANGE: How Much Hotter Is the New “Normal”?
6. Probability in Statistics
6.1 The Role of Probability in Statistics: Statistical Significance
6.2 Basics of Probability
6.3 The Law of Large Numbers
6.4 Ideas of Risk and Life Expectancy
6.5 Combining Probabilities (Supplementary Section)
FOCUS ON SOCIAL SCIENCE: Do Lotteries Harm People with Lower Incomes?
FOCUS ON LAW: Is DNA Analysis Reliable?
7. Correlation and Causality
7.1 Seeking Correlation
USING TECHNOLOGY: Scatterplots and Correlation Coefficients
7.2 Interpreting Correlations
7.3 Best-Fit Lines and Prediction
7.4 The Search for Causality
FOCUS ON EDUCATION: What Helps Children Learn to Read?
FOCUS ON CLIMATE CHANGE: What Is Causing Global Warming (and What Can We Do About It)?
8. Inferences from Samples to Populations
8.1 Sampling Distributions
8.2 Estimating Population Means
USING TECHNOLOGY: Confidence Interval for a Population Mean
8.3 Estimating Population Proportions
USING TECHNOLOGY: Confidence Interval for a Population Proportion
FOCUS ON HISTORY: Where Did Statistics Begin?
FOCUS ON LITERATURE: How Many Words Did Shakespeare Know?
9. Hypothesis Testing
9.1 Fundamentals of Hypothesis Testing
9.2 Hypothesis Tests for Population Means
USING TECHNOLOGY: Hypothesis Test for a Population Mean
9.3 Hypothesis Tests for Population Proportions
USING TECHNOLOGY: Hypothesis Test for a Population Proportion
FOCUS ON HEALTH AND EDUCATION: Will Your Education Help You Live Longer?
FOCUS ON AGRICULTURE: Are Genetically Modified Foods Safe?
10. t Tests, Two-Way Tables, and ANOVA
10.1 t Distribution for Inferences about a Mean
USING TECHNOLOGY: Confidence Intervals Using the t Distribution
USING TECHNOLOGY: Hypothesis Tests with the t Distribution
10.2 Hypothesis Testing with Two-Way Tables
USING TECHNOLOGY: Hypothesis Testing with Two-Way Tables
10.3 Analysis of Variance (One-Way ANOVA)
USING TECHNOLOGY: Analysis of Variance
FOCUS ON CRIMINOLOGY: Can You Tell a Fraud When You See One?
FOCUS ON EDUCATION: What Can a Fourth-Grader Do with Statistics?
FOCUS ON THE COVID-19 PANDEMIC: Have Covid Vaccines Really Saved Lives?
Epilogue: A Perspective on Statistics
Appendices A: z-Score Tables B: Table of Random Numbers Websites and Suggested Readings
Glossary
Credits
Answers
Index
| Erscheint lt. Verlag | 19.4.2023 |
|---|---|
| Sprache | englisch |
| Themenwelt | Wirtschaft ► Volkswirtschaftslehre ► Ökonometrie |
| ISBN-10 | 0-13-810987-7 / 0138109877 |
| ISBN-13 | 978-0-13-810987-5 / 9780138109875 |
| Zustand | Neuware |
| Informationen gemäß Produktsicherheitsverordnung (GPSR) | |
| Haben Sie eine Frage zum Produkt? |
aus dem Bereich

