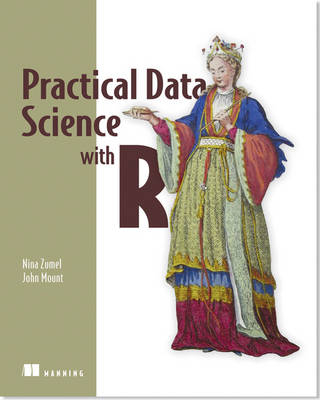
Practical Data Science with R
Manning Publications (Verlag)
978-1-61729-156-2 (ISBN)
- Titel ist leider vergriffen;
keine Neuauflage - Artikel merken
- Demonstrations of need-to-know statistical ideas
- Covers all aspects of the project lifecycle
- Data science for the motivated business professional
»Practical Data Science with R« lives up to its name.
It explains basic principles without the theoretical mumbo-jumbo and jumps right to the real use cases you'll face as you collect, curate, and analyze the data crucial to the success of your business.
You'll apply the R programming language and statistical analysis techniques to carefully explained examples based in marketing, business intelligence, and decision support.
Simply put, data science is the discipline of extracting meaning from data.
While it can involve deep knowledge of statistics, mathematics, machine learning, and computer science, for most non-academics, data science looks like applying analysis techniques to answer key business questions.
»Practical Data Science with R« lives up to its name. It explains basic principles without the theoretical mumbo-jumbo and jumps right to the real use cases faced while collecting, curating, and analyzing the data crucial to the success of businesses.
Readers will apply the R programming language and statistical analysis techniques to carefully-explained examples based in marketing, business intelligence, and decision support, while learning how to create instrumentation, design experiments such as A/B tests, and accurately present data to audiences of all levels.
Written for the business analyst, technical consultant or technical director- no formal statistics or mathematics background is required.
Readers should be comfortable with quantitative thinking plus light scripting or programming. Some familiarity with R is a plus.
Nina Zumel and John Mount are co-founders of Win-Vector, a data science consulting firm in San Francisco. Nina holds a Ph.D. in robotics from Carnegie Mellon and was a content developer for EMC's Data Science and Big Data Analytics Training Course. John has a Ph.D. in computer science from Carnegie Mellon and over 15 years of applied experience in biotech research, online advertising, price optimization and finance. Both contribute to the Win-Vector Blog, which covers topics in statistics, probability, computer science, mathematics and optimization.
foreword
preface
acknowledgments
about this book
about the cover illustration
Part 1 Introduction to data science
Chapter 1 The data science process
The roles in a data science project
Stages of a data science project
Setting expectations
Summary
Chapter 2 Loading data into R
Working with data from files
Working with relational databases
Summary
Chapter 3 Exploring data
Using summary statistics to spot problems
Spotting problems using graphics and visualization
Summary
Chapter 4 Managing data
Cleaning data
Sampling for modeling and validation
Summary
Part 2 Modeling methods
Chapter 5 Choosing and evaluating models
Mapping problems to machine learning tasks
Evaluating models
Validating models
Summary
Chapter 6 Memorization methods
KDD and KDD Cup 2009
Building single-variable models
Building models using many variables
Summary
Chapter 7 Linear and logistic regression
Using linear regression
Using logistic regression
Summary
Chapter 8 Unsupervised methods
Cluster analysis
Association rules
Summary
Chapter 9 Exploring advanced methods
Using bagging and random forests to reduce training variance
Using generalized additive models (GAMs) to learn non-monotone relationships
Using kernel methods to increase data separation
Using SVMs to model complicated decision boundaries
Summary
Part 3 Delivering results
Chapter 10 Documentation and deployment
The buzz dataset
Using knitr to produce milestone documentation
Using comments and version control for running documentation
Deploying models
Summary
Chapter 11 Producing effective presentations
Presenting your results to the project sponsor
Presenting your model to end users
Presenting your work to other data scientists
Summary
appendix A Working with R and other tools
appendix B Important statistical concepts
appendix C More tools and ideas worth exploring
bibliography
index
If you’re a beginning data scientist, or want to be one, Practical Data Science with R (PDSwR) is the place to start. If you’re already doing data science, PDSwR will fill in gaps in your knowledge and even give you a fresh look at tools you use on a daily basis—it did for me. While there are many excellent books on statistics and modeling with R, and a few good management books on applying data science in your organization, this book is unique in that it combines solid technical content with practical, down-to-earth advice on how to practice the craft. I would expect no less from Nina and John. I first met John when he presented at an early Bay Area R Users Group about his joys and frustrations with R. Since then, Nina, John, and I have collaborated on a couple of projects for my former employer. And John has presented early ideas from PDSwR—both to the “big” group and our Berkeley R-Beginners meetup. Based on his experience as a practicing data scientist, John is outspoken and has strong views about how to do things. PDSwR reflects Nina and John’s definite views on how to do data science—what tools to use, the process to follow, the important methods, and the importance of interpersonal communications. There are no ambiguities in PDSwR. This, as far as I’m concerned, is perfectly fine, especially since I agree with 98% of their views. (My only quibble is around SQL—but that’s more an issue of my upbringing than of disagreement.) What their unambiguous writing means is that you can focus on the craft and art of data science and not be distracted by choices of which tools and methods to use. This precision is what makes PDSwR practical. Let’s look at some specifics. Practical tool set: R is a given. In addition, RStudio is the IDE of choice; I’ve been using RStudio since it came out. It has evolved into a remarkable tool—integrated debugging is in the latest version. The third major tool choice in PDSwR is Hadley Wickham’s ggplot2. While R has traditionally included excellent graphics and visualization tools, ggplot2 takes R visualization to the next level. (My practical hint: take a close look at any of Hadley’s R packages, or those of his students.) In addition to those main tools, PDSwR introduces necessary secondary tools: a proper SQL DBMS for larger datasets; Git and GitHub for source code version control; and knitr for documentation generation. Practical datasets: The only way to learn data science is by doing it. There’s a big leap from the typical teaching datasets to the real world. PDSwR strikes a good balance between the need for a practical (simple) dataset for learning and the messiness of the real world. PDSwR walks you through how to explore a new dataset to find problems in the data, cleaning and transforming when necessary. Practical human relations: Data science is all about solving real-world problems for your client—either as a consultant or within your organization. In either case, you’ll work with a multifaceted group of people, each with their own motivations, skills, and responsibilities. As practicing consultants, Nina and John understand this well. PDSwR, is unique in stressing the importance of understanding these roles while working through your data science project. Practical modeling: The bulk of PDSwR. is about modeling, starting with an excellent overview of the modeling process, including how to pick the modeling method to use and, when done, gauge the model’s quality. The book walks you through the most practical modeling methods you’re likely to need. The theory behind each method is intuitively explained. A specific example is worked through—the code and data are available on the authors’ GitHub site. Most importantly, tricks and traps are covered. Each section ends with practical takeaways. In short, Practical Data Science with R is a unique and important addition to any data scientist’s library. Jim Porzak Senior Data Scientist and Cofounder of the Bay Area R Users Group
This is the book we wish we’d had when we were teaching ourselves that collection of subjects and skills that has come to be referred to as data science. It’s the book that we’d like to hand out to our clients and peers. Its purpose is to explain the relevant parts of statistics, computer science, and machine learning that are crucial to data science. Data science draws on tools from the empirical sciences, statistics, reporting, analytics, visualization, business intelligence, expert systems, machine learning, databases, data warehousing, data mining, and big data. It’s because we have so many tools that we need a discipline that covers them all. What distinguishes data science itself from the tools and techniques is the central goal of deploying effective decision-making models to a production environment. Our goal is to present data science from a pragmatic, practice-oriented viewpoint. We’ve tried to achieve this by concentrating on fully worked exercises on real data—altogether, this book works through over 10 significant datasets. We feel that this approach allows us to illustrate what we really want to teach and to demonstrate all the preparatory steps necessary to any real-world project. Throughout our text, we discuss useful statistical and machine learning concepts, include concrete code examples, and explore partnering with and presenting to nonspecialists. We hope if you don’t find one of these topics novel, that we’re able to shine a light on one or two other topics that you may not have thought about recently.
| Vorwort | Jim Porzak |
|---|---|
| Verlagsort | New York |
| Sprache | englisch |
| Maße | 189 x 231 mm |
| Gewicht | 704 g |
| Einbandart | kartoniert |
| Themenwelt | Informatik ► Datenbanken ► Data Warehouse / Data Mining |
| Mathematik / Informatik ► Informatik ► Software Entwicklung | |
| Mathematik / Informatik ► Informatik ► Theorie / Studium | |
| Mathematik / Informatik ► Mathematik ► Computerprogramme / Computeralgebra | |
| Mathematik / Informatik ► Mathematik ► Statistik | |
| Wirtschaft ► Betriebswirtschaft / Management ► Wirtschaftsinformatik | |
| ISBN-10 | 1-61729-156-0 / 1617291560 |
| ISBN-13 | 978-1-61729-156-2 / 9781617291562 |
| Zustand | Neuware |
| Informationen gemäß Produktsicherheitsverordnung (GPSR) | |
| Haben Sie eine Frage zum Produkt? |
aus dem Bereich


