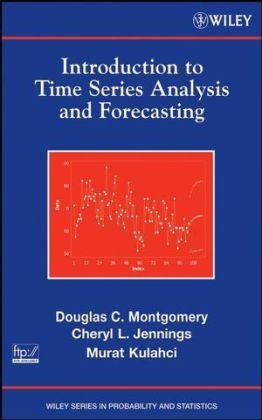
Introduction to Time Series Analysis and Forecasting
Wiley-Blackwell (an imprint of John Wiley & Sons Ltd) (Verlag)
978-0-471-65397-4 (ISBN)
- Titel erscheint in neuer Auflage
- Artikel merken
Seven easy-to-follow chapters provide intuitive explanations and in-depth coverage of key forecasting topics, including: Regression-based methods, heuristic smoothing methods, and general time series models Basic statistical tools used in analyzing time series data Metrics for evaluating forecast errors and methods for evaluating and tracking forecasting performance over time Cross-section and time series regression data, least squares and maximum likelihood model fitting, model adequacy checking, prediction intervals, and weighted and generalized least squares Exponential smoothing techniques for time series with polynomial components and seasonal data Forecasting and prediction interval construction with a discussion on transfer function models as well as intervention modeling and analysis Multivariate time series problems, ARCH and GARCH models, and combinations of forecasts The ARIMA model approach with a discussion on how to identify and fit these models for non-seasonal and seasonal time series The intricate role of computer software in successful time series analysis is acknowledged with the use of Minitab, JMP, and SAS software applications, which illustrate how the methods are imple-mented in practice.
An extensive FTP site is available for readers to obtain data sets, Microsoft Office PowerPoint slides, and selected answers to problems in the book. Requiring only a basic working knowledge of statistics and complete with exercises at the end of each chapter as well as examples from a wide array of fields, Introduction to Time Series Analysis and Forecasting is an ideal text for forecasting and time series courses at the advanced undergraduate and beginning graduate levels. The book also serves as an indispensable reference for practitioners in business, economics, engineering, statistics, mathematics, and the social, environmental, and life sciences.
Douglas C. Montgomery, PhD, is Regents' Professor of Industrial Engineering and Statistics at Arizona State University. Dr. Montgomery has over thirty years of academic and consulting experience and has devoted his research to engineering statistics, specifically the design and analysis of experiments, statistical methods for process monitoring and optimization, and the analysis of time-oriented data. He has authored or coauthored over 190 journal articles and eleven books, including Introduction to Linear Regression Analysis, Fourth Edition and Generalized Linear Models: With Applications in Engineering and the Sciences, both published by Wiley. Cheryl L. Jennings, PhD, is a Process Design Consultant with Bank of America. An active member of both the American Statistical Association and the American Society for Quality, her areas of research and professional interest include Six Sigma; modeling and analysis; and process control and improvement. Dr. Jennings earned her PhD in industrial engineering from Arizona State University. Murat Kulahci, PhD, is Associate Professor in Informatics and Mathematical Modelling at the Technical University of Denmark. He has authored or coauthored over thirty journal articles in the areas of time series analysis, design of experiments, and statistical process control and monitoring.
1. Introduction to Forecasting. 1.1 The Nature and uses of Forecasts. 1.2 Some Examples of Time Series. 1.3 The Forecasting Process. 1.4 Resources for Forecasting. 2. Statistics Background for Forecasting. 2.1 Introduction. 2.2 Graphical Displays. 2.3 Numerical Description of Time Series Data. 2.4 Use of Data Transformations and Adjustments. 2.5 General Approach to Time Series Analysis and Forecasting. 2.6 Evaluating and Monitoring Forecasting Model Performance. 3. Regression Analysis and Forecasting. 3.1 Introduction. 3.2 Least Squares Estimation in Linear Regression Models. 3.3 Statistical Inference in Linear Regression. 3.4 Prediction of New Observations. 3.5 Model Adequacy Checking. 3.6 Variable Selection Methods in Regression. 3.7 Generalized and Weighted Least Squares. 3.8 Regression Models for General Time Series Data. 4. Exponential Smoothing Methods. 4.1 Introduction. 4.2 First-Order Exponential Smoothing. 4.3 Modeling Time series Data. 4.4 Second-Order Exponential Smoothing. 4.5 Higher-Order Exponential Smoothing. 4.6 Forecasting. 4.7 Exponential Smoothing for Seasonal Data. 4.8 Exponential Smoothers and ARIMA Models. 5. Autoregressive Integrated Moving Average (ARIMA) Models. 5.1 Introduction. 5.2 Linear Models for Stationary Time Series. 5.3 Finite Order Moving Average (MA) Processes. 5.4 Finite Order Autoregressive Processes. 5.5 Mixed Autoregressive-Moving Average (ARMA) Processes. 5.6 Non-stationary Processes. 5.7 Time Series Model Building . 5.8 Forecasting ARIMA Processes . 5.9 Seasonal Processes. 5.10 Final Comments. 6. Transfer Function and Intervention Models. 6.1 Introduction. 6.2 Transfer Function Models. 6.3 Transfer Function-Noise Models. 6.4 Cross Correlation Function. 6.5 Model Specification. 6.6 Forecasting with Transfer Function-Noise Models. 6.7 Intervention Analysis. 7. Survey of Other Forecasting Methods. 7.1 Multivariate Time Series Models and Forecasting. 7.2 State Space Models. 7.3 ARCH and GARCH Models. 7.4 Direct Forecasting of Percentiles. 7.5 Combining Forecasts to Improve Prediction Performance. 7.6 Aggregation and Disaggregation of Forecasts. 7.7 Neural Networks and Forecasting. 7.8 Some Comments on Practical Implementation and use of Statistical Forecasting Techniques. Bibliography. Appendix. Appendix A Statistical Tables. Table A.1 Cumulative Normal Distribution. Table A.2 Percentage Points of the Chi-Square Distribution. Table A.3 Percentage Points of the t Distribution. Table A.4 Percentage Points of the F Distribution. Table A.5 Critical Values of the Durbin-Watson Statistic. Appendix B Data Sets for Exercises. Table B.1 Market Yield on U.S. Treasury Securities at 10-year Constant Maturity. Table B.2 Pharmaceutical Product Sales. Table B.3 Chemical Process Viscosity. Table B.4 U.S Production of Blue and Gorgonzola Cheeses. Table B.5 U.S. Beverage Manufacturer Product Shipments, Unadjusted. Table B.6 Global Mean Surface Air Temperature Anomaly and Global CO22 Concentration. Table B.7 Whole Foods Market Stock Price, Daily Closing Adjusted for Splits. Table B.8 Unemployment Rate - Full-Time Labor Force, Not Seasonally Adjusted. Table B.9 International Sunspot Numbers. Table B.10 United Kingdom Airline Miles Flown. Table B.11 Champagne Sales. Table B.12 Chemical Process Yield, with Operating Temperature (Uncontrolled). Table B.13 U.S. Production of Ice Cream and Frozen Yogurt. Table B.14 Atmospheric CO2 Concentrations at Mauna Loa Observatory. Table B.15 U.S. National Violent Crime Rate. Table B.16 U.S. Gross Domestic Product. Table B.17 U.S. Total Energy Consumption. Table B.18 U.S. Coal Production. Table B.19 Arizona Drowning Rate, Children 1-4 Years Old. Table B.20 U.S. Internal Revenue Tax Refunds. Index.
| Erscheint lt. Verlag | 4.4.2008 |
|---|---|
| Reihe/Serie | Wiley Series in Probability and Statistics |
| Verlagsort | Chicester |
| Sprache | englisch |
| Maße | 160 x 244 mm |
| Gewicht | 792 g |
| Einbandart | gebunden |
| Themenwelt | Mathematik / Informatik ► Mathematik ► Wahrscheinlichkeit / Kombinatorik |
| Technik ► Elektrotechnik / Energietechnik | |
| ISBN-10 | 0-471-65397-7 / 0471653977 |
| ISBN-13 | 978-0-471-65397-4 / 9780471653974 |
| Zustand | Neuware |
| Informationen gemäß Produktsicherheitsverordnung (GPSR) | |
| Haben Sie eine Frage zum Produkt? |
aus dem Bereich


