Questions in Dataviz
Taylor & Francis Ltd (Verlag)
978-1-032-14620-1 (ISBN)
- Titel z.Zt. nicht lieferbar
- Versandkostenfrei innerhalb Deutschlands
- Auch auf Rechnung
- Verfügbarkeit in der Filiale vor Ort prüfen
- Artikel merken
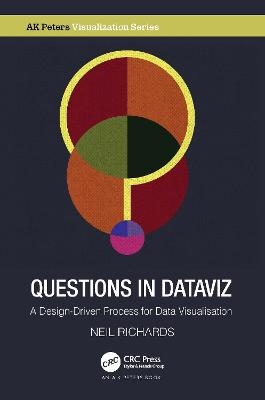
This book takes the reader through the process of learning and creating data visualisation, following a unique journey with questions every step of the way, ultimately discussing how and when to bend and break the "rules" to come up with creative, unique, and sometimes unconventional ideas. Each easy-to-follow chapter poses one key question and provides a selection of discussion points and relevant data visualisation examples throughout.
Structured in three parts: Section I poses questions around some fundamental data visualisation principles, while Section II introduces more advanced questions, challenging perceived best practices and suggesting when rules are open to interpretation or there to be broken. The questions in Section III introduce further themes leading on to specific ideas and visualisation projects in more detail.
Questions in Dataviz: A Design-Driven Process for Data Visualisation will appeal to any reader with an interest in creative or unconventional data visualisation and will be especially useful for those at a beginner or intermediate level looking for inspiration and alternative ways to deploy their data visualisation skills outside of conventional business charts.
Neil Richards is a data visualisation specialist and enthusiast with over twenty-five years’ experience in the data industry. Through his regular personal creative data visualisation projects, he has been awarded the title of Tableau Visionary (formerly Tableau Zen Master) a total of four times, and is a regular speaker at data visualisation conferences and user groups. Formerly Knowledge Director for the Data Visualization Society, he also sits on the Board of data visualisation non-profit Viz For Social Good. Neil works as a Lead Business Intelligence Analyst at JLL and has a BSc. in Mathematics and a BA in Environmental Studies. He lives in Derbyshire in the United Kingdom.
Preface. Author. Introduction. SECTION I First Questions. Chapter 1.1 Should the data drive the visualisation? Chapter 1.2 What’s in a colour? Chapter 1.3 What does data visualisation have in common with psychology? Chapter 1.4 Do data visualisations have to tell a story? Chapter 1.5 Is it OK to steal? Chapter 1.6 Is white space always your friend? Section II Challenging. Questions Chapter 2.1 Why do we visualise data? Chapter 2.2 Why do we visualise using triangles? Chapter 2.3 Does it matter if shapes overlap? Chapter 2.4 What is data humanism? Chapter 2.5 What is design-driven data? Chapter 2.6 Do we take data visualisation too seriously? Chapter 2.7 Why create unnecessary data visualisations? Chapter 2.8 When are several visualisations better than one? Chapter 2.9 What can I do when data is impossible to find? Section III Idea Questions. Chapter 3.1 What is the third wave of data visualisation? Chapter 3.2 What alternative ways are there for visualizing timelines? Chapter 3.3 Why do I use flowers to visualise data? Chapter 3.4 What are Data Portraits? Chapter 3.5 How can I take inspiration from album covers? Chapter 3.6 How many ways can you tile the United States? Chapter 3.7 Is it possible to tile the world? Chapter 3.8 Can you create visualisations using only numbers? Chapter 3.9 How do you visualise music? Chapter 3.10 What are Truchet tiles? Chapter 3.11 How do you create 31 visualisations in a month? Index.
| Erscheinungsdatum | 14.10.2022 |
|---|---|
| Reihe/Serie | AK Peters Visualization Series |
| Zusatzinfo | 153 Line drawings, color; 6 Line drawings, black and white; 153 Illustrations, color; 6 Illustrations, black and white |
| Verlagsort | London |
| Sprache | englisch |
| Maße | 156 x 234 mm |
| Gewicht | 1260 g |
| Themenwelt | Kunst / Musik / Theater ► Design / Innenarchitektur / Mode |
| Informatik ► Datenbanken ► Data Warehouse / Data Mining | |
| Mathematik / Informatik ► Informatik ► Grafik / Design | |
| Technik ► Umwelttechnik / Biotechnologie | |
| ISBN-10 | 1-032-14620-6 / 1032146206 |
| ISBN-13 | 978-1-032-14620-1 / 9781032146201 |
| Zustand | Neuware |
| Informationen gemäß Produktsicherheitsverordnung (GPSR) | |
| Haben Sie eine Frage zum Produkt? |
aus dem Bereich


