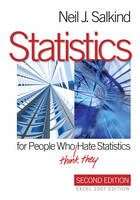
Statistics for People Who (think They) Hate Statistics
SAGE Publications Inc (Verlag)
978-1-4129-7102-7 (ISBN)
- Titel ist leider vergriffen;
keine Neuauflage - Artikel merken
The bestselling text "Statistics for People Who (Think They) Hate Statistics" is the basis for this completely adapted Excel version. Author Neil J. Salkind presents an often intimidating and difficult subject in a way that is informative, personable, and clear. Researchers and students who find themselves uncomfortable with the analysis portion of their work will appreciate this book's unhurried pace and thorough, friendly presentation. Salkind begins the Excel version with a complete introduction to the software, and shows the students how to install the Excel Analysis ToolPak option (free) to earn access to a host of new and very useful analytical techniques. He then walks students through various statistical procedures, beginning with correlations and graphical representation of data and ending with inferential techniques and analysis of variance. Pedagogical features include sidebars offering additional technical information about the topic and set-off points that reinforce major themes. Finally, questions to chapter exercises, a complete glossary, and extensive Excel functionality are located at the back of the book.
Neil J. Salkind is Professor Emeritus at the University of Kansas, where he taught in the Department of Educational Psychology for more than 35 years. His interest is in writing about statistics and research methods in an informative, nonintimidating and noncondescending way. He is also the author of Statistics for People Who (Think They) Hate Statistics, Statistics for People Who (Think They) Hate Statistics (the Excel Edition), Excel Statistics - a Quick Guide, and the recently edited Encyclopedia of Research Design.
Part I: Yippee! I'm in Statistics Chapter 1: Statistics or Sadistics? It's Up to You Part II: Sigma Freud and Descriptive Statistics Chapter 2: Means to an End: Computing and Understanding Averages Chapter 3: Vive la Difference: Understanding Variability Chapter 4: A Picture Really Is Worth a Thousand Words Chapter 5: Ice Cream and Crime: Computing Correlation Coefficients Chapter 6: Just the Truth: An Introduction to Understanding Reliability and Validity Part III: Taking Chances for Fun and Profit Chapter 7: Hypotheticals and You: Testing Your Questions Chapter 8: Are Your Curves Normal? Probability and Why It Counts Part IV: Significantly Different: Using Inferential Statistics Chapter 9: Significantly Significant: What It Means for You and Me Chapter 10: t(ea) for Two: Tests Between the Means of Different Groups Chapter 11: t(ea) for Two (Again): Tests Between the Means of Related Groups Chapter 12: Two Groups Too Many? Try Analysis of Variance Chapter 13: Two Too Many Factors: Factorial Analysis of Variance Chapter 14: Cousins or Just Friends? Testing Relationships Using the Correlation Coefficient Chapter 15: Predicting Who'll Win the Super Bowl: Using linear Regression Chapter 16: What to Do When You're Not Normal: Chi-Square and Some other Nonparametric Tests Chapter 17: Some Other (Important) Statistical Procedures You Should Know About Chapter 18: A Statistical Software Sampler Part V: Ten Things You'll Want to Know and Remember Chapter 19: The Ten Best Internet Sites for Statistics Stuff Chapter 20: The Ten Commandments of Data Collection Appendix A: SPSS in Less Than 30 Minutes Appendix B: Tables Appendix C: Data Sets Appendix D: Your Reward: The Brownie Recipe Glossary Index
| Erscheint lt. Verlag | 10.6.2009 |
|---|---|
| Zusatzinfo | ill |
| Verlagsort | Thousand Oaks |
| Sprache | englisch |
| Maße | 178 x 254 mm |
| Themenwelt | Informatik ► Office Programme ► Excel |
| Mathematik / Informatik ► Mathematik ► Statistik | |
| Sozialwissenschaften ► Soziologie ► Empirische Sozialforschung | |
| ISBN-10 | 1-4129-7102-0 / 1412971020 |
| ISBN-13 | 978-1-4129-7102-7 / 9781412971027 |
| Zustand | Neuware |
| Haben Sie eine Frage zum Produkt? |
aus dem Bereich


