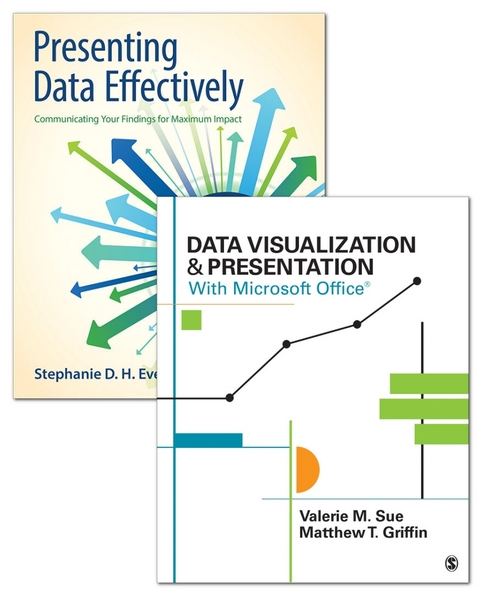
Data Visualization & Presentation with Microsoft Office, Presenting Data Effectively
Sage Publications, Inc (Verlag)
978-1-5063-3229-1 (ISBN)
- Titel ist leider vergriffen;
keine Neuauflage - Artikel merken
Create and present a compelling story with Data Visualization & Presentation with Microsoft Office; the first book to cover both the technical and aesthetic elements of creating accurate, visually appealing data displays using Microsoft Word, Excel, and PowerPoint. This practical book provides step-by-step instructions on procuring, preparing, and presenting data visually without expensive software design programs. Throughout the book, the focus is on turning raw, quantitative data into attractive, well-designed tables and charts that tell an accurate narrative about the underlying information.
Evergreen: Presenting Data Effectively
This is a step-by-step guide to making the research results presented in reports, slideshows, posters, and data visualizations more interesting. Written in an easy, accessible manner, Presenting Data Effectively provides guiding principles for designing data presentations so that they are more likely to be heard, remembered, and used. The guidance in the book stems from the author's extensive study of research reporting, a solid review of the literature in graphic design and related fields, and the input of a panel of graphic design experts.
Those concepts are then translated into language relevant to students, researchers, evaluators, and non-profit workers--anyone in a position to have to report on data to an outside audience. The book guides the reader through design choices related to four primary areas: graphics, type, color, and arrangement. As a result, readers can present data more effectively, with the clarity and professionalism that best represents their work.
Valerie M. Sue is a senior manager at Kaiser Permanente (KP). She manages a range of projects for KP's Market Strategy and Sales Operations Department and provides data visualization consultation to KP executives and staff. Prior to joining KP, Sue was an associate professor of communication at California State University, East Bay. At CSU, East Bay she taught communication theory, research methods, survey research, statistics, and was the director of the Communication Department's graduate program. She has authored numerous journal articles, book chapters, and an online survey methods text. Sue earned a PhD in Communication from Stanford University.
Dr. Stephanie Evergreen is an internationally-recognized speaker, designer, and researcher. She is best known for bringing a research-based approach to helping researcher better communicate their work through more effective graphs, slides, and reports. She holds a PhD from Western Michigan University in interdisciplinary evaluation, which included a dissertation on the extent of graphic design use in written research reporting. Dr. Evergreen has trained researchers worldwide through keynote presentations and workshops, for clients including Time, Verizon, Head Start, American Institutes for Research, Rockefeller Foundation, Brookings Institute, and the United Nations. She is the 2015 recipient of the American Evaluation Association’s Guttentag award, given for notable accomplishments early in a career. Dr. Evergreen is co-editor and co-author of two issues of New Directions for Evaluation on data visualization.
| Erscheinungsdatum | 07.01.2016 |
|---|---|
| Sprache | englisch |
| Maße | 188 x 231 mm |
| Gewicht | 930 g |
| Themenwelt | Sozialwissenschaften ► Soziologie ► Allgemeines / Lexika |
| Sozialwissenschaften ► Soziologie ► Empirische Sozialforschung | |
| ISBN-10 | 1-5063-3229-3 / 1506332293 |
| ISBN-13 | 978-1-5063-3229-1 / 9781506332291 |
| Zustand | Neuware |
| Informationen gemäß Produktsicherheitsverordnung (GPSR) | |
| Haben Sie eine Frage zum Produkt? |
aus dem Bereich


