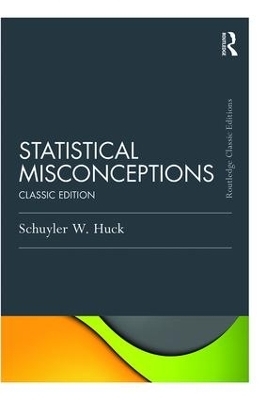
Statistical Misconceptions
Routledge (Verlag)
978-1-138-12007-5 (ISBN)
The author’s accessible discussion of each misconception has five parts:
The Misconception - a brief description of the misunderstanding
Evidence that the Misconception Exists – examples and claimed prevalence
Why the Misconception is Dangerous – consequence of having the misunderstanding
Undoing the Misconception - how to think correctly about the concept
Internet Assignment - an interactive activity to help readers gain a firm grasp of the statistical concept and overcome the misconception.
The book's statistical misconceptions are grouped into 12 chapters that match the topics typically taught in introductory/intermediate courses. However, each of the 52 discussions is self-contained, thus allowing the misconceptions to be covered in any order without confusing the reader. Organized and presented in this manner, the book is an ideal supplement for any standard textbook.
An ideal supplement for undergraduate and graduate courses in statistics, research methods, or quantitative analysis taught in psychology, education, business, nursing, medicine, and the social sciences. The book also appeals to independent researchers interested in undoing their statistical misconceptions.
Schuyler W. Huck is Distinguished Professor and Chancellor's Teaching Scholar at the University of Tennessee - Knoxville. A prolific author on improving statistical instruction and helping consumers decipher research reports, his publications have been cited in over 337 journals.
Introduction to the Classic Edition. Part 1. Descriptive Statistics. 1.1. Measures of Central Tendency. 1.2. The Mean of Means. 1.3. The Mode’s Location. 1.4. The Standard Deviation. Part 2. Distributional Shape. 2.1. The Shape of the Normal Curve. 2.2. Skewed Distributions and Measures of Central Tendency. 2.3. Standard Scores and Normality. 2.4. Rectangular Distributions and Kurtosis. Part 3. Bivariate Correlation. 3.1. Correlation Coefficients. 3.2. Correlation and Causality. 3.3. The Effect of a Single Outlier on Pearson’s r. 3.4. Relationship Strength and r. 3.5. The Meaning of r = 0. Part 4. Reliability and Validity. 4.1. Statistical Indices of Reliability and Validity. 4.2. Interrater Reliability. 4.3. Cronbach’s Alpha and Unidimensionality. 4.4. Range Restriction and Predictive Validity. Part 5. Probability. 5.1. The Binomial Distribution and N. 5.2. A Random Walk With a Perfectly Fair Coin. 5.3. Two Goats and a Car. 5.4. Identical Birthdays. 5.5. The Sum of an Infinite Number of Numbers. 5.6.Being Diagnosed With a Rare Disease. 5.7. Risk Ratios and Odds Ratios. Part 6. Sampling. 6.1.The Character of Random Samples. 6.2. Random Replacements When Sampling. 6.3 Precision and the Sampling Fraction. 6.4. Matched Samples. 6.5. Finite Versus Infinite Populations. Part 7. Estimation. 7.1. Interpreting a Confidence Interval. 7.2. Overlapping Confidence Intervals. 7.3. The Mean ± the Standard Error. 7.4. Confidence Intervals and Replication. Part 8. Hypothesis Testing. 8.1. Alpha and Type I Error Risk. 8.2. The Null Hypothesis. 8.3.Disproving Ho. 8.4. The Meaning of p. 8.5. Directionality and Tails. 8.6. The Relationship Between Alpha and Beta Errors. Part 9. t-Tests Involving One or Two Means. 9.1.Correlated t-Tests. 9.2. The Difference Between Two Means If p < .00001. 9.3. The Robustness of a t-Test When n1 = n2. Part 10. ANOVA and ANCOVA. 10.1. Pairwise Comparisons. 10.2. The Cause of a Significant Interaction. 10.3. Equal Covariate Means in ANCOVA. Part 11. Practical Significance, Power, and Effect Size. 11.1. Statistical Significance Versus Practical Significance. 11.2. A Priori and Post Hoc Power. 11.3. Eta Squared and Partial Eta Squared. Part 12. Regression. 12.1. Comparing Two rs; Comparing Two bs. 12.2. R2. 12.3. Predictor Variables that Are Uncorrelated with Y. 12.4. Beta Weights.
| Erscheint lt. Verlag | 14.12.2015 |
|---|---|
| Reihe/Serie | Psychology Press & Routledge Classic Editions |
| Zusatzinfo | 23 Tables, black and white; 23 Halftones, black and white |
| Verlagsort | London |
| Sprache | englisch |
| Maße | 152 x 229 mm |
| Gewicht | 430 g |
| Themenwelt | Geisteswissenschaften ► Psychologie |
| Mathematik / Informatik ► Mathematik ► Statistik | |
| Pflege ► Studiengänge ► Pflegewissenschaft | |
| Sozialwissenschaften ► Pädagogik | |
| Sozialwissenschaften ► Soziologie | |
| ISBN-10 | 1-138-12007-3 / 1138120073 |
| ISBN-13 | 978-1-138-12007-5 / 9781138120075 |
| Zustand | Neuware |
| Haben Sie eine Frage zum Produkt? |
aus dem Bereich


