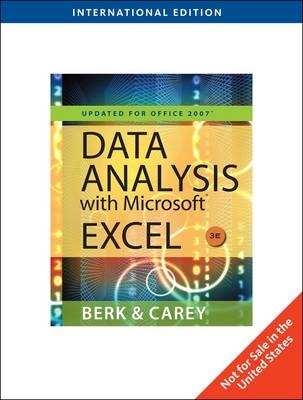
Data Analysis with Microsoft Excel
Brooks/Cole (Verlag)
978-0-495-83149-5 (ISBN)
- Titel ist leider vergriffen;
keine Neuauflage - Artikel merken
1. Getting Started with Excel. Special Files for This Book. Excel and Spreadsheets. Excel Workbooks and Worksheets. Worksheet Cells. Printing from Excel. Saving Your Work. Excel Add-Ins. Features of Statplus. Exiting Excel. 2. Working with Data. Data entry. Data Formats. Formulas and Functions. Cell References. Range Names. Sorting Data. Querying Data. Importing Data from Text Files. Importing Data from Databases. Exercises. 3. Working with Charts. Working with Excel Charts. Introducing Scatterplots. Creating Charts with the Chart Wizard. Editing a Chart. Identifying Data Points. Creating Bubble Plots. Breaking a Scatterplot into Categories. Plotting Several Variables. Exercises. PART II: FUNDAMENTALS OF STATISTICS. 4. Describing Your Data. Variables and Descriptive Statistics. Looking at Distributions with Frequency Tables. Working with Histograms. Working with Stem and Leaf Plots. Distribution Statistics. Working with Boxplots. Exercises. 5. Probability Distributions. Probability. Probability Distributions. Random Variables and Random Samples. The Normal Distribution. Parameters and Estimators. The Sampling Distribution. The Central Limit Theorem. Exercises. 6. Statistical Inference. Confidence Intervals. Hypothesis Testing. The t-Distribution. Applying the t-Test to Paired Data. Applying a Nonparametric Test to Paired Data. The Two-Sample t-Test. Applying the t-Test to Two-Sample Data. Applying a Nonparametric Test to Two-Sample Data. Final Thoughts about Statistical Inference. Exercises. 7. Tables. Pivot Tables. Two-Way Tables. Computing Expected Counts. The Pearson Chi-Square Statistic. Other Table Statistics. Validity of the Chi-Square Test with Small Frequencies. Tables with Ordinal Variables. Exercises. PART III: STATISTICAL METHODS. 8. Regression and Correlation. Simple Linear Regression. Regression Functions in Excel. Performing a Regression on Analysis. Checking the Regression Model. Correlation. Creating a Correlation Matrix. Creating a Scatterplot Matrix. Exercises. 9. Multiple Regression. Regression Models with Multiple Parameters. Regression Example: Predicting Grades. Testing Regression Assumptions. Plotting Residuals s. Predicted Values. Regression Example: Sex Discrimination. Exercises. 10. Analysis of Variance. One-Way Analysis of Variance. Analysis of Variance Example: Comparing Hotel Prices. Comparing Means. Using the Bonferroni Correction Factor. When to Use Bonferroni. One-Way Analysis of Variance and Regression. Two-Way Analysis of Variance. A Two-Factor Example. Two-Way Analysis Example: Comparing Soft Drinks. Exercises. 11. Time Series. Time Series Concepts. Time Series Example: The Dow in the 1980s. The Autocorrelation Function. Moving Averages. Simple Exponential Smoothing. Two-Parameter Exponential Smoothing. Seasonality. Seasonal Example: Beer Production. Three-Parameter Exponential. Smoothing. Optimizing the Exponential. Smoothing Constant (Optional). Exercises. 12. Quality Control. Statistical Quality Control. Control Charts. The Chi [Overbar] Chart. The Range Chart. The C-Chart. The P-Chart. Control Charts for Individual Observations. The Pareto Chart. Exercises. Appendix. Excel Reference. Bibliography. Index.
| Erscheint lt. Verlag | 1.4.2010 |
|---|---|
| Zusatzinfo | Illustrations |
| Verlagsort | CA |
| Sprache | englisch |
| Maße | 186 x 234 mm |
| Gewicht | 958 g |
| Themenwelt | Informatik ► Office Programme ► Excel |
| Mathematik / Informatik ► Mathematik ► Computerprogramme / Computeralgebra | |
| ISBN-10 | 0-495-83149-2 / 0495831492 |
| ISBN-13 | 978-0-495-83149-5 / 9780495831495 |
| Zustand | Neuware |
| Informationen gemäß Produktsicherheitsverordnung (GPSR) | |
| Haben Sie eine Frage zum Produkt? |
aus dem Bereich


