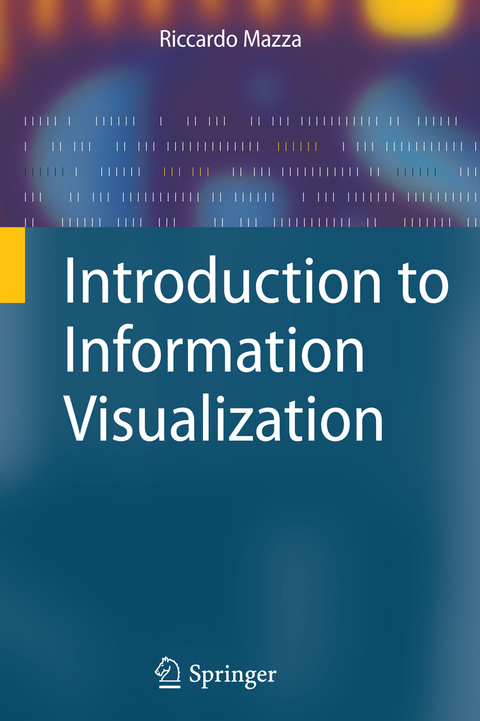
Introduction to Information Visualization
Springer London Ltd (Verlag)
978-1-84800-218-0 (ISBN)
Information Visualization is a relatively young field that is acquiring more and more concensus in both academic and industrial environments. 'Information Visualization' explores the use of computer-supported interactive graphical representations to explain data and amplify cognition. It provides a means to comunicate ideas or facts about the data, to validate hypotheses, and facilitates the discovery of new facts via exploration.
This book introduces the concepts and methods of Information Visualization in an easy-to-understand way, illustrating how to pictorially represent structured and unstructured data, making it easier to comprehend and interpret. Riccardo Mazza focuses on the human aspects of the process of visualization rather than the algorithmic or graphic design aspects.
to Visual Representations.- Creating Visual Representations.- Perception.- Multivariate Analysis.- Networks and Hierarchies.- WorldWideWeb.- Interactions.- Evaluations.
From the reviews:"This excellent book is written in an accessible language and is well structured, making it a fine textbook for an introductory course on information visualization (IV). Extensive use of good examples and figures will help readers quickly grasp the essentials of the different techniques and concepts presented. … All in all, this book is a good starting point for understanding the goal of IV, getting a broad overview of the field, comprehending the main techniques proposed to date, and raising interest in future developments." (Angelica de Antonio, ACM Computing Reviews, July, 2009)“In eight well-illustrated chapters, Mazza moves you through basic theory and simplified visualization techniques to reader response theory and highly complex techniques. … meant to be a textbook for a course in information visualization. … I find this book highly useful in understanding how to handle massive quantities of data visually. … If used as a reference book, it points the way to solving problems related to visual representation of data in real time. … a useful book for both academics and practitioners.” (Tom Warren, Technical Communication, Vol. 57 (3), August, 2010)
| Erscheint lt. Verlag | 2.4.2009 |
|---|---|
| Zusatzinfo | 81 Illustrations, color; 12 Illustrations, black and white; XVIII, 139 p. 93 illus., 81 illus. in color. |
| Verlagsort | England |
| Sprache | englisch |
| Maße | 155 x 235 mm |
| Themenwelt | Mathematik / Informatik ► Informatik ► Betriebssysteme / Server |
| Informatik ► Grafik / Design ► Digitale Bildverarbeitung | |
| Mathematik / Informatik ► Informatik ► Netzwerke | |
| Informatik ► Software Entwicklung ► User Interfaces (HCI) | |
| Informatik ► Theorie / Studium ► Künstliche Intelligenz / Robotik | |
| ISBN-10 | 1-84800-218-1 / 1848002181 |
| ISBN-13 | 978-1-84800-218-0 / 9781848002180 |
| Zustand | Neuware |
| Haben Sie eine Frage zum Produkt? |
aus dem Bereich


