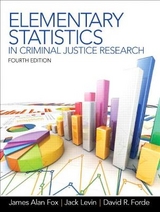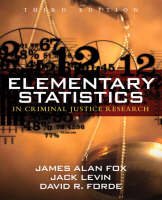
Elementary Statistics in Criminal Justice Research
Pearson (Verlag)
978-0-205-59439-9 (ISBN)
- Titel erscheint in neuer Auflage
- Artikel merken
All chapters end with Summary and Questions and Problems.
Preface.
1. Why the Criminal Justice Researcher Uses Statistics.
The Nature of Criminal Justice Research.
Major Data Sources in Criminology and Criminal Justice.
Why Test Hypotheses?
The Stages of Criminal Justice Research.
Using Series of Numbers to Do Criminal Justice Research.
Functions of Statistics.
Looking and the Larger Picture: A Student Survey.
I. DESCRIPTION.
2. Organizing the Data.
Frequency Distributions of Nominal Data.
Comparing Distributions.
Proportions and Percentages.
Rates.
Simple Frequency Distributions of Ordinal and Interval Data.
Grouped Frequency Distributions of Interval Data.
Cumulative Distributions.
Percentile Ranks.
Dealing with Decimal Data.
Flexible Class Intervals.
Cross-Tabulations.
Graphic Presentations.
3. Measures of Central Tendency.
The Mode.
The Median.
The Mean.
Taking One Step at a Time.
Comparing the Mode, Median, and Mean.
4. Measures of Variability.
The Range.
The Variance and Standard Deviation.
The Raw-Score Formula for Variance and Standard Deviation.
The Meaning of the Standard Deviation.
Obtaining the Variance and Standard Deviation from a Simple Frequency Distribution.
Obtaining the Variance and Standard Deviation from a Grouped Frequency Distribution.
II. FROM DESCRIPTION TO DECISION MAKING.
5. Probability and the Normal Curve.
Rules of Probability.
Probability Distributions.
The Normal Curve as a Probability Distribution.
Characteristics of the Normal Curve.
The Model and the Reality of the Normal Curve.
The Area Under the Normal Curve.
Standard Scores and the Normal Curve.
Finding Probability Under the Normal Curve.
Finding Scores from Probability from the Normal Curve.
6. Samples and Populations.
Sampling Methods.
Sampling Error.
Sampling Distribution of Means.
Standard Error of the Mean.
Confidence Intervals.
The t Distribution.
Estimating Proportions.
Looking at the Larger Picture: Generalizing from Samples to Populations.
III. DECISION MAKING.
7. Testing Differences between Means.
The Null Hypothesis: No Difference between Means.
The Research Hypothesis: A Difference between Means.
Sampling Distribution of Differences between Means.
Testing Hypotheses with the Distribution of Differences between Means.
Levels of Significance.
Standard Error of the Difference between Means.
Testing the Difference between Means.
Comparing the Dependent Samples.
Two Sample Tests of Proportions.
One-Tailed Tests.
Requirements for Testing the Difference between Means.
8. Analysis of Variance.
The Logic of Analysis of Variance.
The Sum of Squares.
Mean Square.
The F Ratio.
A Multiple Comparison of Means.
Requirements for Using the F Ratio.
Groups Using Analysis of Variance.
9. Nonparametric Tests of Significance.
One-Way Chi-Square Test.
Two-Way Chi-Square Test.
The Median Test.
Looking at the Larger Picture: Testing for Differences.
IV. FROM DECISION MAKING TO ASSOCIATION.
10. Correlation.
Strength of Correlation.
Direction of Correlation.
Curvilinear Correlation.
The Correlation Coefficient.
Pearson's Correlation Coefficient.
The Importance of Scatter Plots.
Partial Correlation.
11. Regression Analysis.
The Regression Model.
Interpreting the Regression Line.
Prediction Errors.
Regression and Pearson's Correlation.
Regression and Analysis of Variance.
Multiple Regression.
Dependent Variable Using Regression Analysis.
12. Nonparametric Measures of Correlation.
Spearman's Rank-Order Correlation Coefficient.
Goodman's and Kruskal's Gamma.
Correlation Coefficient for Nominal Data Arranged in a 2 x 2 Table.
Correlation Coefficients for Nominal Data in Larger than 2 x 2 Tables.
Looking at the Larger Picture: Measuring Associations.
13. Applying Statistical Procedures to Research Problems.
Research Situations.
Research Solutions.
Appendix A: Using ABCalc and SPSS
Appendix B: A Review of Some Fundamentals of Mathematics
Appendix C: Tables
Appendix D: List of Formulas
Glossary.
Answers to Problems.
Index.
| Erscheint lt. Verlag | 19.2.2008 |
|---|---|
| Sprache | englisch |
| Maße | 233 x 188 mm |
| Gewicht | 603 g |
| Themenwelt | Mathematik / Informatik ► Mathematik ► Statistik |
| Recht / Steuern ► Strafrecht ► Kriminologie | |
| Sozialwissenschaften ► Soziologie ► Empirische Sozialforschung | |
| ISBN-10 | 0-205-59439-5 / 0205594395 |
| ISBN-13 | 978-0-205-59439-9 / 9780205594399 |
| Zustand | Neuware |
| Informationen gemäß Produktsicherheitsverordnung (GPSR) | |
| Haben Sie eine Frage zum Produkt? |
aus dem Bereich
