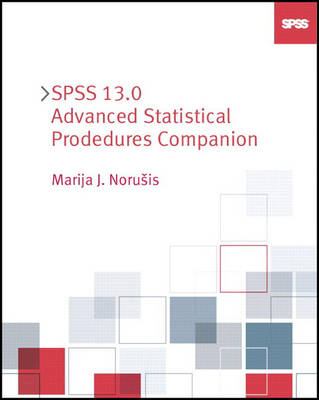
SPSS 13.0 Advanced Statistical Procedures Companion
Pearson (Verlag)
978-0-13-186540-2 (ISBN)
- Titel erscheint in neuer Auflage
- Artikel merken
1. Model Selection Loglinear Analysis
Loglinear Modeling Basics.
A Two-Way Table.
The Saturated Model.
Main Effects.
Interactions.
Examining Parameters in a Saturated Model.
Calculating the Missing Parameter Estimates.
Testing Hypotheses about Parameters.
Fitting an Independence Model.
Specifying the Model.
Checking Convergence.
Chi-Square Goodness-of-Fit Tests.
Hierarchical Models.
Generating Classes.
Selecting a Model.
Evaluating Interactions.
Testing Individual Terms in the Model.
Model Selection Using Backward Elimination.
2. Logit Loglinear Analysis
Dichotomous Logit Model.
Loglinear Representation.
Logit Model.
Specifying the Model.
Parameter Estimates for the Saturated Logit Model.
Unsaturated Logit Model.
Specifying the Analysis.
Goodness-of-Fit Statistics.
Observed and Expected Cell Counts.
Parameter Estimates.
Measures of Dispersion and Association.
Polychotomous Logit Model.
Specifying the Model.
Goodness of Fit of the Model.
Interpreting Parameter Estimates.
Examining Residuals.
Covariates.
Other Logit Models.
3. Multinomial Logistic Regression
The Logit Model.
Baseline Logit Example.
Specifying the Model.
Parameter Estimates.
Likelihood-Ratio Test for Individual Effects.
Likelihood-Ratio Test for the Overall Model.
Evaluating the Model.
Calculating Predicted Probabilities and Expected Frequencies.
Classification Table.
Goodness-of-Fit Tests.
Examining the Residuals.
Pseudo-R-square Measures.
Correcting for Overdispersion.
Automated Variable Selection.
Hierarchical Variable Entry.
Specifying the Analysis.
Step Output.
Likelihood-Ratio Tests for Individual Effects.
Matched Case-Control Studies.
The Model.
Creating the Difference Variables.
The Data File.
Specifying the Analysis.
Examining the Results.
4. Ordinal Regression
Fitting an Ordinal Logit Model.
Modeling Cumulative Counts.
Specifying the Analysis.
Parameter Estimates.
Testing Parallel Lines.
Does the Model Fit?
Comparing Observed and Expected Counts.
Including Additional Predictor Variables.
Overall Model Test.
Measuring Strength of Association.
Classifying Cases.
Generalized Linear Models.
Link Function.
Fitting a Heteroscedastic Probit Model.
Modeling Signal Detection.
Fitting a Location-Only Model.
Fitting a Scale Parameter.
Parameter Estimates.
Model-Fitting Information
5. Probit Regression
Probit and Logit Response Models.
Evaluating Insecticides.
Confidence Intervals for Expected Dosages.
Comparing Several Groups.
Comparing Relative Potencies of the Agents.
Estimates of Relative Median Potency
Estimating the Natural Response Rate.
More than One Stimulus Variable.
6. Kaplan-Meier Survival Analysis
SPSS Procedures for Survival Data.
Background.
Calculating Length of Time.
Estimating the Survival Function.
Estimating the Conditional Probability.
Estimating the Cumulative Probability of Survival.
The SPSS Kaplan-Meier Table.
Plotting Survival Functions.
Comparing Survival Functions.
Specifying the Analysis.
Comparing Groups.
Stratified Comparisons of Survival Functions.
7. Life Tables
Background
Studying Employment Longevity.
The Body of a Life Table.
Calculating Survival Probabilities.
Assumptions Needed to Use the Life Table.
Lost to Follow-up 1
Plotting Survival Functions.
Comparing Survival Functions.
8. Cox Regression
The Cox Regression Model.
The Hazard Function.
Proportional Hazards Assumption.
Modeling Survival Times.
Coding Categorical Variables.
Specifying the Analysis.
Testing Hypotheses about the Age Coefficient.
Interpreting the Regression Coefficient.
Baseline Hazard and Cumulative Survival Rates
Including Multiple Covariates.
The Model with Three Covariates.
Global Tests of the Model.
Plotting the Estimated Functions
Checking the Proportional Hazards Assumption.
Stratification.
Log-Minus-Log Survival Plot.
Identifying Influential Cases.
Examining Residuals.
Partial (Schoenfeld) Residuals.
Martingale Residuals.
Selecting Predictor Variables.
Variable Selection Methods.
An Example of Forward Selection.
Omnibus Test of the Model At Each Step.
Time-Dependent Covariates.
Examining the Data.
Specifying a Time-Dependent Covariate.
Calculating Segmented Time-Dependent Covariates.
Testing the Proportional Hazard Assumption with a Time-Dependent Covariate
Fitting a Conditional Logistic Regression Model.
The Data File Structure.
Specifying the Analysis.
Parameter Estimates.
9. Variance Components Examples
Factors, Effects, and Models.
Types of Factors.
Types of Effects.
Types of Models.
Model for One-Way Classification.
Estimation Methods.
Negative Variance Estimates.
Nested Design Model for Two-Way Classification.
Univariate Repeated Measures Analysis Using a Mixed Model Approach
Background Information.
Model.
Distribution Assumptions.
Estimation Methods.
10. Linear Mixed Models
The Linear Mixed Model.
Background.
11. Nonlinear Regression Examples
What Is a Nonlinear Model?
Transforming Nonlinear Models.
Intrinsically Nonlinear Models.
Fitting a Logistic Population Growth Model.
Estimating a Nonlinear Model.
Finding Starting Values.
Specifying the Analysis.
Approximate Confidence Intervals for the Parameters.
Bootstrap Estimates.
Estimating Starting Values.
Use Starting Values from Previous Analysis.
Look for a Linear Approximation.
Use Properties of the Nonlinear Model.
Solve a System of Equations.
Computational Issues.
Additional Nonlinear Regression Options.
Nonlinear Regression Common Models.
Specifying a Segmented Model.
12. Two-Stage Least-Squares Regression
Artichoke Data
Demand-Price-Income Economic Model.
Estimation with Ordinary Least Squares.
Feedback and Correlated Errors.
Two-Stage Least Squares.
Strategy.
Stage 1: Estimating Price.
Stage 2: Estimating the Model.
2-Stage Least Squares Procedure.
13. Weighted Least-Squares Regression
Diagnosing the Problem.
Estimating the Weights.
Estimating Weights as Powers.
Specifying the Analysis.
Examining the Log-Likelihood Functions.
WLS Solutions. .
Estimating Weights from Replicates.
Diagnostics from the Linear Regression Procedure.
14. Multidimensional Scaling
Data, Models, and Analysis of Multidimensional Scaling.
Example: Flying Mileages.
The Nature of Data Analyzed in MDS.
The Measurement Level of Data.
The Shape of Data.
The Conditionality of Data.
Missing Data.
Multivariate Data.
Classical MDS.
Example: Flying Mileages Revisited.
The Euclidean Model.
Details of CMDS.
Example: Ranked Flying Mileages.
Repeated CMDS.
Replicated MDS.
Details of RMDS.
Example: Perceived Body-Part Structure.
Weighted MDS.
Geometry of the Weighted Euclidean Model.
Algebra of the Weighted Euclidean Model.
Matrix Algebra of the Weighted Euclidean Model.
Details of WMDS.
Example: Perceived Body-Part Structure.
The Weirdness Index.
Flattened Weights.
| Erscheint lt. Verlag | 14.4.2005 |
|---|---|
| Zusatzinfo | Illustrations |
| Sprache | englisch |
| Maße | 188 x 231 mm |
| Gewicht | 582 g |
| Themenwelt | Mathematik / Informatik ► Mathematik ► Computerprogramme / Computeralgebra |
| ISBN-10 | 0-13-186540-4 / 0131865404 |
| ISBN-13 | 978-0-13-186540-2 / 9780131865402 |
| Zustand | Neuware |
| Haben Sie eine Frage zum Produkt? |
aus dem Bereich


