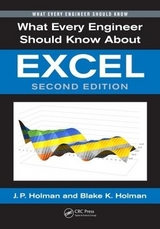
What Every Engineer Should Know About Excel
Crc Press Inc (Verlag)
978-0-8493-7326-8 (ISBN)
- Titel erscheint in neuer Auflage
- Artikel merken
With the many software packages available today, it's easy to overlook the computational and graphics capabilities offered by Microsoft® Excel™. The software is nearly ubiquitous and understanding its capabilities is an enormous benefit to engineers in almost any field and at all levels of experience. What Every Engineer Should Know About Excel offers in nine self-contained chapters a practical guide to the features and functions that can be used, for example, to solve equations and systems of equations, build charts and graphs, create line drawings, and perform optimizations. The author uses examples and screenshots to walk you through the steps and build a strong understanding of the material.
With this book, you will learn how to…
Set up the keyboard for direct entry of most math and Greek symbols
Build a default scatter graph that is applicable to most simple presentations with little cosmetic modification
Apply many types of formats to adjust the cosmetics of graphs
Use 3D surface and area charts for data and functional representations, with associated cosmetic adjustments
Correlate data with various types of functional relations
Use line drawing tools to construct simple schematics or other diagrams
Solve linear and nonlinear sets of equations using multiple methods
Curve student grades using Excel probability functions
Model device performance using different types of regression analysis involving multiple variables
Manipulate Excel financial functions
Calculate retirement accumulation with variable contribution rate and retirement payouts to match increases in inflation
Apply Excel methods for optimization problems with both linear and nonlinear relations
Use pivot tables to manipulate both experimental data and analytical relationships
Calculate experimental uncertainties using Excel
And much more!
INTRODUCTION
Getting the Most from Excel
Conventions
Outline of
MISCELLANEOUS OPERATIONS IN EXCEL AND WORD
Introduction
Print Screen or Screen Dump
Custom Keyboard Setup for Symbols in Word
Viewing or Printing Column and Row Headings and Gridlines in Excel
Assorted Instructions
Moving Objects in Small Increments (Nudging)
Formatting Objects in Word, Including Wrapping
Formatting Objects in Excel
Use of Photo-Editing Software in Word, Including Wrapping
Copying Cell Formulas: Effect of Relative and Absolute Addresses
Copying Formulas by Dragging the Fill Handle
Shortcut for Changing the Status of Cell Addresses
Switching and Copying Columns or Rows, and Changing Rows to Columns or Columns to Rows
Built-In Functions in Excel
Creating Single-Variable Tables Using the DATA/TABLE Command
Creating Two-Variable Tables Using the DATA/TABLE Command
Problems
CHARTS AND GRAPHS
Introduction
Moving Dialog Windows
Excel Chart Wizard Window Showing Choice of x-y Scatter Charts
Selecting and Adding Data for x-y Scatter Charts
Changing and Adding Data for Charts Using the SOURCE DATA Command
Adding Data to Charts Using the ADD DATA Command
Adding Trendlines and Correlation Equations to Scatter Charts
Equation for R2
Correlation of Experimental Data with Power Relation
Use of Logarithmic Scales
Correlation with Exponential Functions
Use of Different Scatter Graphs for the Same Data
Plot of a Function of Two Variables with Different Chart Types
Plots of Two Variables with and without Separate Scales
Charts Used for Calculation Purposes or G&A Format
Stretching Out a Chart from a Single Chart Page
Alternate Chart Sizing Procedure Using MS Word
Calculation and Graphing of Moving Averages
Bar and Column Charts
Chart Format and Cosmetics
Surface Charts
Suggested Scatter Graph Setting as Default Chart
An Exercise in 3-D Visualization
Editing Excel Charts Using Word
Editing Excel Tables Using Word
Alternate Procedure
Editing Excel Charts Directly in Word by Using Grouping
Problems
LINE DRAWINGS AND EMBEDDED OBJECTS IN EXCEL
Introduction
Constructing, Moving, and Inserting Straight Line Drawings
Inserting Items in Excel with Symbols, Subscripts, and Superscripts
Inserting Equations or Symbols in Word Using Equation Editor
Inserting Equations and Symbols in Excel Using Equation Editor
Construction of Line Drawings from Plotted Coordinates
Problems
SOLUTION OF EQUATIONS
Introduction
Solutions to Single Nonlinear Equations Using Goal Seek
Solutions to Single Nonlinear Equations Using Solver
Iterative Solutions to Simultaneous Linear Equations
Solutions of Simultaneous Linear Equations Using Matrix Inversion
Solutions of Simultaneous Nonlinear Equations Using Solver
Solver Results Dialog Box
Comparison of Methods for Solution of Simultaneous Linear Equations
Copying Cell Equations for Repetitive Calculations
Creating and Running Macros
Problems
OTHER OPERATIONS
Introduction
Numerical Evaluation of Integrals
Use of Logical IF Statement
Histograms and Cumulative Frequency Distributions
Normal Error Distributions
Calculation of Uncertainty Propagation in Experimental Results
Fractional Uncertainties for Product Functions of Primary Variables
Multivariable Linear Regression
Multivariable Exponential Regression
Problems
FINANCIAL FUNCTIONS AND CALCULATIONS
Introduction
Nomenclature
Compound Interest Formulas
Investment Accumulation with Increasing Annual Payments
Payout at Variable Rates from an Initial Investment
Problems
OPTIMIZATION PROBLEMS
Introduction
Graphical Examples of Linear and Nonlinear Optimization Problems
Solutions Using Solver
Solver Answer Reports for Examples
Nomenclature for Sensitivity Reports
Nomenclature for Answer Reports
Nomenclature for Limits Reports
Problems
PIVOT TABLES
Introduction
Other Summary Functions for Data Fields
Restrictions on Pivot Table Formulas
Calculating and Charting Single or Multiple Functions f(x) vs. x Using Pivot Tables
Calculating and Plotting Functions of Two Variables
Problems
REFERENCES
INDEX
| Erscheint lt. Verlag | 9.6.2006 |
|---|---|
| Reihe/Serie | What Every Engineer Should Know |
| Zusatzinfo | 275 Illustrations, black and white |
| Verlagsort | Bosa Roca |
| Sprache | englisch |
| Maße | 178 x 254 mm |
| Gewicht | 454 g |
| Themenwelt | Informatik ► Office Programme ► Excel |
| ISBN-10 | 0-8493-7326-3 / 0849373263 |
| ISBN-13 | 978-0-8493-7326-8 / 9780849373268 |
| Zustand | Neuware |
| Haben Sie eine Frage zum Produkt? |
aus dem Bereich


