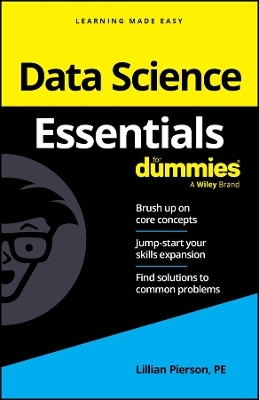
Data Science Essentials For Dummies
For Dummies (Verlag)
978-1-394-29700-9 (ISBN)
Data Science Essentials For Dummies is a quick reference on the core concepts of the exploding and in-demand data science field, which involves data collection and working on dataset cleaning, processing, and visualization. This direct and accessible resource helps you brush up on key topics and is right to the point—eliminating review material, wordy explanations, and fluff—so you get what you need, fast.
Strengthen your understanding of data science basics
Review what you've already learned or pick up key skills
Effectively work with data and provide accessible materials to others
Jog your memory on the essentials as you work and get clear answers to your questions
Perfect for supplementing classroom learning, reviewing for a certification, or staying knowledgeable on the job, Data Science Essentials For Dummies is a reliable reference that's great to keep on hand as an everyday desk reference.
Lillian Pierson, PE, is the founder and fractional CMO at Data-Mania, as well as a globally recognized growth leader in technology. To date, she has helped educate approximately 2 million professionals on how to leverage AI, data strategy, and data science to drive business growth.
Introduction 1
About This Book 2
Foolish Assumptions 3
Icons Used in This Book 3
Where to Go from Here 4
Chapter 1: Wrapping Your Head Around Data Science 5
Seeing Who Can Make Use of Data Science 6
Inspecting the Pieces of the Data Science Puzzle 8
Collecting, querying, and consuming data 9
Applying mathematical modeling to data science tasks 11
Deriving insights from statistical methods 11
Coding, coding, coding — it’s just part of the game 12
Applying data science to a subject area 12
Communicating data insights 14
Chapter 2: Tapping into Critical Aspects of Data Engineering 15
Defining the Three Vs 15
Grappling with data volume 16
Handling data velocity 16
Dealing with data variety 17
Identifying Important Data Sources 18
Grasping the Differences among Data Approaches 18
Defining data science 19
Defining machine learning engineering 20
Defining data engineering 20
Comparing machine learning engineers, data scientists, and data engineers 21
Storing and Processing Data for Data Science 22
Storing data and doing data science directly in the cloud 22
Processing data in real-time 27
Recognizing the Impact of Generative AI 27
The reshaping of data engineering 28
Tools and frameworks for supporting AI workloads 28
Chapter 3: Using a Machine to Learn from Data 29
Defining Machine Learning and Its Processes 29
Walking through the steps of the machine learning process 30
Becoming familiar with machine learning terms 30
Considering Learning Styles 31
Learning with supervised algorithms 31
Learning with unsupervised algorithms 32
Learning with reinforcement 32
Seeing What You Can Do 32
Selecting algorithms based on function 33
Generating real-time analytics with Spark 36
Chapter 4: Math, Probability, and Statistical Modeling 39
Exploring Probability and Inferential Statistics 40
Probability distributions 42
Conditional probability with Naïve Bayes 44
Quantifying Correlation 45
Calculating correlation with Pearson’s r 45
Ranking variable pairs using Spearman’s rank correlation 47
Reducing Data Dimensionality with Linear Algebra 48
Decomposing data to reduce dimensionality 48
Reducing dimensionality with factor analysis 52
Decreasing dimensionality and removing outliers with PCA 53
Modeling Decisions with Multiple Criteria Decision-Making 54
Turning to traditional MCDM 55
Focusing on fuzzy MCDM 57
Introducing Regression Methods 57
Linear regression 57
Logistic regression 59
Ordinary least squares regression methods 60
Detecting Outliers 60
Analyzing extreme values 60
Detecting outliers with univariate analysis 61
Detecting outliers with multivariate analysis 62
Introducing Time Series Analysis 64
Identifying patterns in time series 64
Modeling univariate time series data 65
Chapter 5: Grouping Your Way into Accurate Predictions 67
Starting with Clustering Basics 68
Getting to know clustering algorithms 69
Examining clustering similarity metrics 71
Identifying Clusters in Your Data 72
Clustering with the k-means algorithm 72
Estimating clusters with kernel density estimation 74
Clustering with hierarchical algorithms 75
Dabbling in the DBScan neighborhood 77
Categorizing Data with Decision Tree and Random Forest Algorithms 79
Drawing a Line between Clustering and Classification 80
Introducing instance-based learning classifiers 81
Getting to know classification algorithms 81
Making Sense of Data with Nearest Neighbor Analysis 84
Classifying Data with Average Nearest Neighbor Algorithms 86
Classifying with K-Nearest Neighbor Algorithms 89
Understanding how the k-nearest neighbor algorithm works 90
Knowing when to use the k-nearest neighbor algorithm 91
Exploring common applications of k-nearest neighbor algorithms 92
Solving Real-World Problems with Nearest Neighbor Algorithms 92
Seeing k-nearest neighbor algorithms in action 92
Seeing average nearest neighbor algorithms in action 93
Chapter 6: Coding Up Data Insights and Decision Engines 95
Seeing Where Python Fits into Your Data Science Strategy 95
Using Python for Data Science 96
Sorting out the various Python data types 98
Putting loops to good use in Python 101
Having fun with functions 103
Keeping cool with classes 104
Checking out some useful Python libraries 107
Chapter 7: Generating Insights with Software Applications 115
Choosing the Best Tools for Your Data Science Strategy 116
Getting a Handle on SQL and Relational Databases 118
Investing Some Effort into Database Design 123
Defining data types 123
Designing constraints properly 124
Normalizing your database 124
Narrowing the Focus with SQL Functions 127
Making Life Easier with Excel 131
Using Excel to quickly get to know your data 132
Reformatting and summarizing with PivotTables 137
Automating Excel tasks with macros 139
Chapter 8: Telling Powerful Stories with Data 143
Data Visualizations: The Big Three 144
Data storytelling for decision-makers 145
Data showcasing for analysts 145
Designing data art for activists 146
Designing to Meet the Needs of Your Target Audience 146
Step 1: Brainstorm (All about Eve) 147
Step 2: Define the purpose 148
Step 3: Choose the most functional visualization type for your purpose 149
Picking the Most Appropriate Design Style 150
Inducing a calculating, exacting response 150
Eliciting a strong emotional response 151
Selecting the Appropriate Data Graphic Type 152
Standard chart graphics 154
Comparative graphics 157
Statistical plots 161
Topology structures 162
Spatial plots and maps 164
Testing Data Graphics 167
Adding Context 168
Creating context with data 169
Creating context with annotations 169
Creating context with graphical elements 169
Chapter 9: Ten Free or Low-Cost Data Science Libraries and Platforms 171
Scraping the Web with Beautiful Soup 171
Wrangling Data with pandas 172
Visualizing Data with Looker Studio 172
Machine Learning with scikit-learn 172
Creating Interactive Dashboards with Streamlit 173
Doing Geospatial Data Visualization with Kepler.gl 173
Making Charts with Tableau Public 173
Doing Web-Based Data Visualization with RAWGraphs 174
Making Cool Infographics with Infogram 174
Making Cool Infographics with Canva 174
Index 175
| Erscheinungsdatum | 24.12.2024 |
|---|---|
| Sprache | englisch |
| Maße | 140 x 213 mm |
| Gewicht | 181 g |
| Themenwelt | Mathematik / Informatik ► Informatik ► Datenbanken |
| Informatik ► Office Programme ► Outlook | |
| Informatik ► Software Entwicklung ► User Interfaces (HCI) | |
| ISBN-10 | 1-394-29700-9 / 1394297009 |
| ISBN-13 | 978-1-394-29700-9 / 9781394297009 |
| Zustand | Neuware |
| Informationen gemäß Produktsicherheitsverordnung (GPSR) | |
| Haben Sie eine Frage zum Produkt? |
aus dem Bereich


