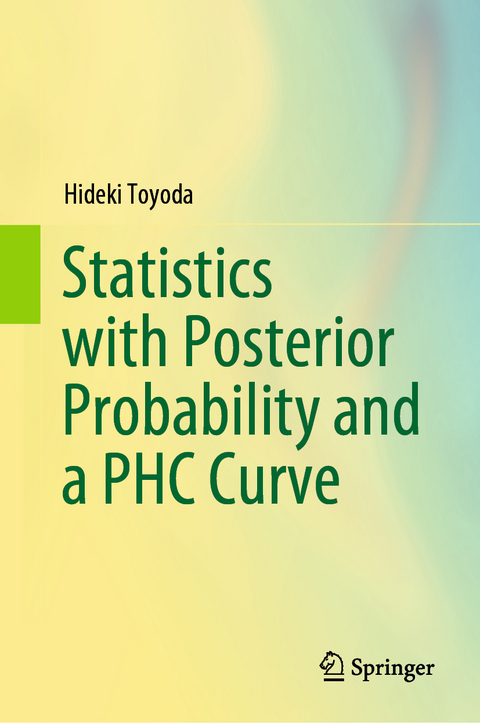
Statistics with Posterior Probability and a PHC Curve
Springer Nature (Verlag)
978-981-97-3093-3 (ISBN)
In recent years, there have been several reports that the results of studies using significant tests cannot be reproduced. It is a problem called a “reproducibility crisis”. For example, suppose we could reject the null hypothesis that “the average number of days to recovery in patients who took a new drug was the same as that in the control group”. However, rejecting the null hypothesis is only a necessary condition for the new drug to be effective. Even if the necessary conditions are met, it does not necessarily mean that the new drug is effective. In fact, there are many cases where the effect is not reproduced. Sufficient conditions should be presented, such as “the average number of days until recovery in patients who take new drugs is sufficiently short compared to the control group, evaluated from a medical point of view”, without paying attention to necessary conditions.
This book reconstructs statistics from the perspective of PHC, i.e., probability that a research hypothesis is correct. For example, the PHC curve shows the posterior probability that the statement “The average number of days until recovery for patients taking a new drug is at least θ days shorter than that of the control group” is correct as a function of θ. Using the PHC curve makes it possible to discuss the sufficient conditions rather than the necessary conditions for being an efficient treatment. The value of statistical research should be evaluated with concrete indicators such as “90% probability of being at least 3 days shorter”, not abstract metrics like the p-value.
As a psychometrician and an expert in structural equation modeling, the author has calculated the brand value of Brand Japan since the first survey. Brand Japan is a brand value evaluation project sponsored by Nikkei BP Consulting, which has been implemented since 2001. The project visualizes the evaluations of over 50,000 people for 1,500 brands of companies, products, and services. It is the largest brand value evaluation survey in Japan and is useful for verifying the results of practical brand strategies, public relations activities, and marketing, as well as setting future goals. The author is also an expert in item response theory and has been in charge of the planning, analysis, and evaluation of the Nikkei TEST since 2008, when the first public test was held. The Nikkei Test is a test organized by the Nikkei newspaper that measures the "breadth and amount of knowledge necessary for business, as well as the ability to think". The test uses questions created from real-world economics and is represented by five evaluation axes. There are four types of Nikkei Tests, which can be chosen based on the purpose and form of the test. These include a nationwide simultaneous test (online test), a corporate/group test, a test center test, and a Nikkei Test training drill. The test is a valuable tool for self-analysis and evaluation, as well as for accelerating skill development.
chapter01 Data summary and theoretical distribution.- chapter02 Posterior Distribution and Bayes' Theorem.- chapter03 Inference about a normal distribution.- chapter04 Generated quantities.- chapter05 phc curve and ROPE.- chapter06 Inference about two normal distributions.- chapter07 Group difference between two independent groups.- chapter08 Bivariate and multivariate data.- chapter09 difference score of paired two groups.- chapter10 Independent one-factor analysis.- chapter11 Independent two-factor analysis.- chapter12 Binomial distribution model.- chapter13 Multinomial distribution model.- chapter14 simple regression model.- chapter15 multiple regression model.- chapter16 Interpreting partial regression coefficients.- chapter17 Logistic regression / Meta-analysis.- chapter18 Poisson model / Log-linear model.- chapter19 Independent one-factor analysis with various distributions.- chapter20 Analysis of covariance / Propensity score.- chapter21 Advanced experimental design.- chapter22 Hierarchical linear model.
| Erscheinungsdatum | 18.06.2024 |
|---|---|
| Zusatzinfo | 17 Illustrations, color; 152 Illustrations, black and white; XXIII, 404 p. 169 illus., 17 illus. in color. |
| Sprache | englisch |
| Maße | 155 x 235 mm |
| Themenwelt | Mathematik / Informatik ► Mathematik ► Statistik |
| Mathematik / Informatik ► Mathematik ► Wahrscheinlichkeit / Kombinatorik | |
| Sozialwissenschaften ► Soziologie ► Empirische Sozialforschung | |
| Schlagworte | Bayesian Statistics • Generated Quantities • Markov chain Monte Carlo method • MCMC • PHC • posterior probability • Probability That Research Hypothesis is Correct • Stan |
| ISBN-10 | 981-97-3093-7 / 9819730937 |
| ISBN-13 | 978-981-97-3093-3 / 9789819730933 |
| Zustand | Neuware |
| Haben Sie eine Frage zum Produkt? |
aus dem Bereich


