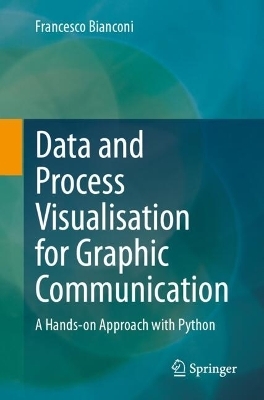
Data and Process Visualisation for Graphic Communication
Springer International Publishing (Verlag)
978-3-031-57050-6 (ISBN)
This book guides the reader through the process of graphic communication with a particular focus on representing data and processes. It considers a variety of common graphic communication scenarios among those that arise most frequently in practical applications.
The book is organized in two parts: representing data (Part I) and representing processes (Part II). The first part deals with the graphical representation of data. It starts with an introductory chapter on the types of variables, then guides the reader through the most common data visualization scenarios - i.e.: representing magnitudes, proportions, one variable as a function of the other, groups, relations, bivariate, trivariate and geospatial data. The second part covers various tools for the visual representation of processes; these include timelines, flow-charts, Gantt charts and PERT diagrams. In addition, the book also features four appendices which cover cross-chapter topics: mathematics and statistics review, Matplotlib primer, color representation and usage, and representation of geospatial data.
Aimed at junior and senior undergraduate students in various technical, scientific, and economic fields, this book is also a valuable aid for researchers and practitioners in data science, marketing, entertainment, media and other fields.
Francesco Bianconi is Associate Professor of Design Tools and Methods in Industrial Engineering in the Department of Engineering at the University of Perugia, Italy. He has held visiting positions at the University of Vigo (Spain), the University of East Anglia (UK), Queen Mary University of London (UK) and City University of London (UK). He conducts research on computer vision, image processing and pattern recognition with a particular focus on texture and color analysis for industrial and biomedical applications. Francesco is an IEEE senior member, chartered Engineer and court-appointed expert.
Part I: Data.- 1. Introducing data.- 2. Magnitudes.- 3. Proportions.- 4. One variable as a function of the other.- 5. Frequency distributions.- 6. Groups.- 7. Relations.- 8. Bivariate data.- 9. Trivariate data.- 10. Geospatial data.- Part II: Representing processes.- 11. Timelines.- 12. Flowcharts.- 13. Gantt charts.- 14. PERT diagrams.
| Erscheinungsdatum | 17.05.2024 |
|---|---|
| Zusatzinfo | XIX, 242 p. 98 illus., 84 illus. in color. |
| Verlagsort | Cham |
| Sprache | englisch |
| Maße | 155 x 235 mm |
| Themenwelt | Mathematik / Informatik ► Informatik ► Programmiersprachen / -werkzeuge |
| Informatik ► Software Entwicklung ► User Interfaces (HCI) | |
| Mathematik / Informatik ► Mathematik ► Wahrscheinlichkeit / Kombinatorik | |
| Schlagworte | Data Visualization • Graphic Communication • matplotlib • process visualization • Python programming • seaborn |
| ISBN-10 | 3-031-57050-2 / 3031570502 |
| ISBN-13 | 978-3-031-57050-6 / 9783031570506 |
| Zustand | Neuware |
| Informationen gemäß Produktsicherheitsverordnung (GPSR) | |
| Haben Sie eine Frage zum Produkt? |
aus dem Bereich


