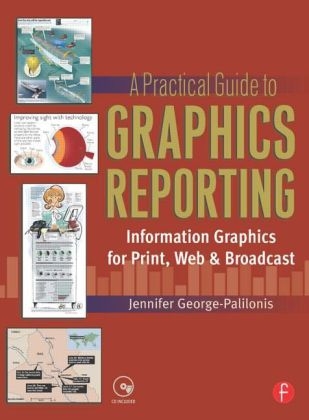
A Practical Guide to Graphics Reporting
Focal Press (Verlag)
978-0-240-80707-2 (ISBN)
- Titel erscheint in neuer Auflage
- Artikel merken
A Practical Guide to Graphics Reporting explains all of the most important skills and theoretical considerations for creating diagrams, charts, maps, and other forms of information graphics intended to provide readers with valuable visual and textual news and information.
Research and writing skills as they relate to graphics reporting are explained, as well as illustration techniques for maps and diagrams, rules for creating basic charts and diagrams, and the various types of uses for maps in graphics reporting.
While other texts related to these topics may address similar skill sets, A Practical Guide to Graphics Reporting uniquely teaches these skills in the context of journalistic storytelling and visual reporting.
Newspapers, magazines, online publications, and various other media employ information graphics reporters. Studying this text in conjunction with instruction in journalistic visual storytelling prepares you to enter this field. This text offers a solid foundation for print and online graphics reporters and helps beginners and professionals alike become better, well-rounded visual communicators.
CHAPTER ONE: Mastering the Art of Visual Storytelling
Graphics History
Our Visual Culture
The Role of the Graphics Reporter
Spotting Graphics Potential
The Visual Editor
In the Eyes of an Expert: J. Ford Huffman, USA Today
Chapter One Exercise
Graphics Potential Packaging Form
CHAPTER TWO: Multimedia Storytelling: How Different Media Use Graphics
Print Graphics & News Coverage
Sept. 11, 2001: A Case Study
Digital Media Formats: Animation & Interactivity
MSNBC.com: A Case Study
Information Graphics & Convergence
One Graphic, Three Formats: A Case Study
In the Eyes of an Expert: Don Wittekind
South Florida Sun-Sentinel
Chapter Two Exercise
CHAPTER THREE: Research & Writing for Information Graphics
Sifting Through the Rubble
Developing a Source List
Information Graphics & News Coverage
In the Eyes of an Expert: Michael Price
San Diego Union-Tribune
Chapter Three Exercise
CHAPTER FOUR: Ethics & Graphics Reporting
The Graphics Reporter's Code of Conduct
Visual Plagiarism & Copyright
The Internet as a Source
Working with Numbers
Diversity in Information Graphics
In the Eyes of an Expert: Jeff Goertzen, St. Petersburg Times
Chapter Four Exercise
CHAPTER FIVE: Designing Information Graphics
The Seven Basic Design Principles
Working with a Grid
Color & Type Palettes
In the Eyes of an Expert: Ron Reason, Design Consultant
Chapter Five Exercise
CHAPTER SIX: Cartography for Journalists
Functions of Maps
Kinds of Maps
The Physical Components of a Map
Map Construction
Color in Maps
Type in Maps
Maps in the News
In the Eyes of an Expert: George Rorick,
The Poynter Institute for Media Studies & USA Today
Chapter Six Exercises
CHAPTER SEVEN: Charts, Tables & Text-Based Graphics
Text-Based Graphics
Pie Charts
Bar Charts
Fever Charts
Tips for All Types of Graphics
In the Eyes of an Expert: Angela Smith
The State-Journal Register
Chapter Seven Exercises
CHAPTER EIGHT: Statistical Data Displays: Taking the "Numb Out of Numbers
Spotting Problems with Statistics
Establishing Validity in Polls and Surveys
In the Eyes of an Expert: Kris Goodfellow, ESRI
Chapter Eight Exercise
CHAPTER NINE: Diagrams & Illustrative Graphics Types of Diagrams Organizing the Content Illustration Techniques In the Eyes of an Expert: Nigel Holmes, Explanation Graphics Chapter Nine Exercises
| Erscheint lt. Verlag | 31.3.2006 |
|---|---|
| Verlagsort | Oxford |
| Sprache | englisch |
| Maße | 189 x 246 mm |
| Gewicht | 476 g |
| Themenwelt | Kunst / Musik / Theater ► Design / Innenarchitektur / Mode |
| Mathematik / Informatik ► Informatik ► Grafik / Design | |
| Sozialwissenschaften ► Kommunikation / Medien ► Journalistik | |
| ISBN-10 | 0-240-80707-3 / 0240807073 |
| ISBN-13 | 978-0-240-80707-2 / 9780240807072 |
| Zustand | Neuware |
| Haben Sie eine Frage zum Produkt? |
aus dem Bereich


