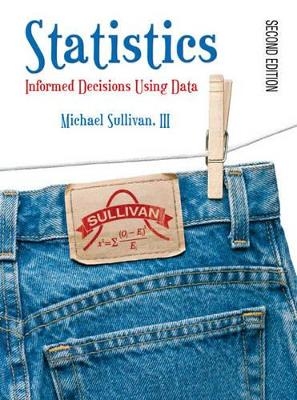
Statistics
Pearson
978-0-13-187149-6 (ISBN)
- Titel erscheint in neuer Auflage
- Artikel merken
For algebra-based Introductory Statistics Courses.
This very popular text is written to promote student success while maintaining the statistical integrity of the course. The author draws on his teaching experience and background in statistics and mathematics to achieve this balance. Three fundamental objectives motivate this text: (1) to generate and maintain student interest, thereby promoting student success and confidence; (2) to provide extensive and effective opportunity for student practice; (3) Allowing for flexibility of teaching styles.
Datasets and other resources (where applicable) for this book are available here.
Michael Sullivan III is a Professor of mathematics at Joliet Junior College. He holds graduate degrees from DePaul University in both mathematics and economics. Mike is a very successful textbook author, having co-authored the following texts Precalculus Enhanced with Graphing Utilities 4e (CR 2006) College Algebra Enhanced with Graphing Utilities 4e (CR2006) Algebra and Trigonometry Enhanced with Graphing Utilities 4e (CR2006) His time in the classroom and extensive authoring experience has given him an excellent foundation to write a successful introductory Statistics text: Statistics: Informed Decisions Using Data 2e (2007) and a briefer version of this text, Fundamentals of Statistics, 1/e (2005). Because Mike’s passion is making math more exciting and accessible to students, he is coauthoring a developmental math series for Prentice Hall that will be published in 2007. These titles will include: Elementary Algebra (CR2007) Intermediate Algebra (CR2007) Elementary and Intermediate Algebra (CR2007) Mike is the proud father of three children and when he isn’t teaching or writing, he can be found coaching his children’s baseball and soccer teams.
Part I: Getting the Information You Need
Chapter 1 Data Collection
1.1 Introduction to the Practice of Statistics
1. Define statistics
2. Understand the process of statistics
3. Distinguish between qualitative and quantitative variables
4. Distinguish between discrete and continuous variables
1.2 Observational Studies, Experiments, and Simple Random Sampling
1. Distinguish between an observational study and an experiment
2. Obtain a simple random sample
1.3 Other Effective Sampling Methods
1. Obtain a stratified sample
2. Obtain a systematic sample
3. Obtain a cluster sample
1.4 Sources of Error in Sampling
1. Understand how error can be introduced during sampling
1.5 The Design of Experiments
1. Define designed experiment
2. Understand the steps in designing an experiment
3. Understand the completely randomized design
4. Understand the randomized block design
5. Understand the matched-pairs design
Chapter Review
Case Study:
Part II: Descriptive Statistics
Chapter 2 Organizing and Summarizing Data from One Variable
2.1 Organizing Qualitative Data
1. Organize qualitative data in tables
2. Construct bar graphs
3. Construct pie charts
2.2 Organizing Quantitative Data — The Popular Displays
1. Organize discrete data in tables
2. Construct histograms of discrete data
3. Organize continuous data in tables
4. Construct histograms of continuous data
5. Draw stem-and-leaf plots
6. Identify the shape of a distribution
2.3 Additional Displays of Quantitative Data
1. Construct frequency polygons
2. Create cumulative frequency and relative frequency tables
3. Construct frequency and relative frequency ogives
4. Draw time series graphs
2.4 Graphical Misrepresentations of Data
1. Describe what can make a graph misleading or deceptive
Chapter Review
Case Study
Chapter 3 Numerically Describing Data from One Variable
3.1 Measures of Central Tendency
1. Determine the arithmetic mean of a variable from raw data
2. Determine the median of a variable from raw data
3. Determine the mode of the variable from raw data
4. Use the mean and the median to help identify the shape of a distribution
3.2 Measures of Dispersion
1. Compute the range of a variable from raw data
2. Compute the variance of a variable from raw data
3. Compute the standard deviation of a variable from raw data
4. Use the Empirical Rule to describe data that are bell-shaped
5. Use Chebyshev’s inequality to describe any set of data
3.3 Measures of Central Tendency and Dispersion from Grouped Data
1. Approximate the mean of a variable from grouped data
2. Compute the weighted mean
3. Approximate the standard deviation of a variable from grouped data
3.4 Measures of Position
1. Determine and interpret z-scores
2. Determine and interpret percentiles
3. Determine and interpret quartiles
4. Check a set of data for outliers
3.5 The Five-Number Summary and Boxplots
1. Compute the five-number summary
2. Draw and interpret boxplots
Chapter Review
Case Study
Chapter 4 Describing the Relation between Two Variables
4.1 Scatter Diagrams and Correlation
1. Draw scatter diagrams
2. Interpret scatter diagrams
3. Understand the properties of the linear correlation coefficient
4. Compute and interpret the linear correlation coefficient
4.2 Least-Squares Regression
1. Find the least-squares regression line
2. Interpret the slope and y-intercept of the least-squares regression line
3. Predict the value of the response variable using the least-squares regression line
4. Determine the values of the residuals
5. Compute the sum of squared residuals
4.3 Diagnostics on the Least-Squares Regression Line
1. Compute and interpret the coefficient of determination
2. Perform residual analysis on a regression model
3. Identify influential observations
4.4 Nonlinear Regression (On CD)
1. Change exponential expressions to logarithmic expressions and logarithmic expressions to exponential expressions
2. Simplify expressions containing logarithms
3. Use logarithmic transformations to linearize exponential relations
4. Use logarithmic transformations to linearize power relations
Chapter Review
Case Study
Part III: Probability and Probability Distributions
Chapter 5 Probability
5.1 Probability Rules
1. Understand the properties of probabilities
2. Compute and interpret probabilities using the empirical method
3. Compute and interpret probabilities using the classical method
4. Use simulation to obtain probabilities
5. Understand subjective probabilities
5.2 The Addition Rule and Complements
1. Use the Addition Rule for Disjoint Events
2. Use the General Addition Rule
3. Compute the Probability of an Event Using the Complement Rule
5.3 Independence and the Multiplication Rule
1. Understand Independence
2. Use the Multiplication Rule for Independent Events
3. Compute “at least” probabilities
5.4 Conditional Probability
1. Compute Conditional Probabilities
2. Compute Probabilities Using the General Multiplication Rule
5.5 Counting Techniques
1. Solve counting problems using the Multiplication Principle
2. Solve counting problems using permutations
3. Solve counting problems using combinations
4. Solve counting problems using permutations with repetition
5. Compute probabilities involving permutations and combinations
5.6 Bayes’s Rule (ON CD)
1. Use the Theorem of Total Probability
2. Use Bayes’ Theorem to compute probabilities
Chapter Review
Case Study
Chapter 6 Discrete Probability Distributions
6.1 Discrete Random Variables
1. Distinguish between discrete and continuous random variables
2. Identify discrete probability distributions
3. Construct probability histograms
4. Compute and interpret the mean of a discrete random variable
5. Interpret the mean of a discrete random variable as an expected value
6. Compute the variance and standard deviation of a discrete random variable
6.2 The Binomial Probability Distribution
1. Determine whether a probability experiment is a binomial experiment
2. Compute probabilities of binomial experiments
3. Compute the mean and standard deviation of a binomial random variable
4. Construct binomial probability histograms
6.3 The Poisson Probability Distribution
1. Understand when a probability experiment follows a Poisson process
2. Compute probabilities of a Poisson random variable
3. Find the mean and standard deviation of a Poisson random variable
6.4 The Hypergeometric Probability Distribution (ON CD)
1. Determine whether a probability experiment is a hypergeometric experiment
2. Compute probabilities of hypergeometric experiments
3. Compute the mean and standard deviation of a hypergeometric random variable
Chapter Review
Case Study
Chapter 7 The Normal Probability Distribution
7.1 Properties of the Normal Distribution
1. Understand the uniform probability distribution
2. Graph a normal density curve
3. State the properties of the normal curve
4. Understand the role of area in the normal distribution
5. Understand the relation between a normal random variable and a standard normal random variable
7.2 The Standard Normal Distribution
1. Find the area under the standard normal curve
2. Find z-scores for a given area
3. Interpret the area under a standard normal curve as a probability
7.3 Applications of the Normal Distribution
1. Find and interpret area under a normal curve
2. Find the value of a normal random variable
7.4 Assessing Normality
1. Draw a normal probability plot to assess normality
7.5 The Normal Approximation to the Binomial Probability Distribution
1. Approximate binomial probabilities using the normal model
Chapter Review
Case Study
Part IV: Inference — From Samples to Population
Chapter 8 Sampling Distributions
8.1 Distribution of the Sample Mean
1. Understand the concept of a sampling distribution
2. Compute the mean and standard deviation of a sampling distribution of the mean
3. Compute probabilities of a sample mean for samples obtained from a normal population
4. Compute probabilities of a sample mean for samples obtained from a population that is not normal
8.2 Distribution of the Sample Proportion
1. Compute the mean and standard deviation of a sampling distribution of a proportion
2. Compute probabilities of a sample proportion
Chapter Review
Case Study
Chapter 9 Estimating the Value of a Parameter Using Confidence Intervals
9.1 The Logic in Constructing Confidence Intervals about a Population Mean Where the Population Standard Deviation is Known
1. Compute the point estimate of the population mean
2. Construct and interpret a confidence interval about the population mean (assuming the population standard deviation is known)
3. Understand the role of margin of error in constructing a confidence interval
4. Determine the sample size necessary for estimating the population mean within a specified margin of error
9.2 Confidence Intervals about a Population Mean in Practice Where the Population Standard Deviation is Unknown
1. Know the properties of Student’s t-distribution
2. Determine t-values
3. Construct and interpret a confidence interval about a population mean
9.3 Confidence Intervals about a Population Proportion
1. Obtain a point estimate for the population proportion
2. Construct and interpret a confidence interval for the population proportion
3. Determine the sample size necessary for estimating a population proportion within a specified margin of error
9.4 Confidence Intervals about a Population Standard Deviation
1. Find critical values for the chi-square distribution
2. Construct and interpret confidence intervals about s2 and s
9.5 Putting It All Together: Which Method Do I Use?
1. Determine the appropriate confidence interval to construct
Chapter Review
Case Study
Chapter 10 Testing Claims Regarding a Parameter
10.1 The Language of Hypothesis Testing
1. Determine the null and alternative hypothesis from a claim
2. Understand Type I and Type II errors
3. Understand the probability of making a Type I or Type II error
4. State conclusions to hypothesis tests
10.2 Testing Claims about a Population Mean Where the Population Standard Deviation Is Known
1. Understand the logic of hypothesis testing
2. Test a claim about a population mean with s known using P-values
3. Test a claim about a population mean with s known using the classical method
4. Test a claim about a population mean with s known using confidence intervals
5. Understand the difference between practical significance and statistical significance
10.3 Testing Claims about a Population Mean in Practice
1. Test a claim about a population mean with s unknown
10.4 Testing Claims about a Population Proportion
1. Test a claim about a population proportion using the normal model
2. Test a claim about a population proportion using the binomial distribution function
10.5 Testing Claims about a Population Standard Deviation
1. Test a claim about a population standard deviation
10.6 Putting It All Together: Which Method Do I Use?
1. Determine the appropriate hypothesis test to perform
10.7 The Probability of a Type II Error and the Power of the Test
1. Determine the probability of making a Type II error
2. Compute the power of the test
Chapter Review
Case Study
Chapter 11 Inference on Two Samples
11.1 Inference about Two Means: Dependent Samples
1. Distinguish between independent and dependent samples
2. Test claims made regarding matched-pairs data
3. Construct and interpret confidence intervals about the population mean difference of matched-pairs data
11.2 Inference about Two Means: Independent Samples
1. Test claims regarding the difference of two means
2. Construct and interpret confidence intervals regarding the difference of two means
11.3 Inference about Two Population Proportions
1. Test claims regarding the difference between two population proportions
2. Construct and interpret confidence intervals for the difference between two population proportions
3. Determine the sample size necessary for estimating the difference between two population proportions within a specified margin of error
11.4 Inference about Two Population Standard Deviations
1. Find critical values of the F-distribution
2. Test claims regarding two population standard deviations
Chapter Review
Case Study
Chapter 12 Inference on Categorical Data
12.1 Goodness of Fit Test
1. Perform a chi-square goodness of fit test
12.2 Contingency Tables and Association
2. Compute the marginal distribution of a variable
3. Use the conditional distribution to identify association among categorical data
12.3 Tests for Independence and the Homogeneity of Proportions
1. Perform chi-square test for independence
2. Perform chi-square test for homogeneity of proportions
Chapter Review
Case Study
Chapter 13 Comparing Three or More Means
13.1 Inference on the Completely Randomized Design (One —way Analysis of Variance)
1. Verify the requirements to perform one-way ANOVA
2. Test a claim regarding three or more means using one-way ANOVA
13.2 Post-hoc Tests on One-way Analysis of Variance
1. Perform the Tukey Test
13.3 Inference on the Randomized Complete Block Design
1. Perform an analysis of variance on the randomized block design
2. Perform the Tukey Test
13.4 Two-way Analysis of Variance
1. Analyze a Two-way Analysis of Variance design
2. Draw interaction plots
3. Perform the Tukey Test
Chapter Review
Case Study
Chapter 14 Inference on the Least-squares Regression Model and Multiple Regression
14.1 Testing the Significance of the Least-squares Regression Model
1. Understand the requirements of the least-squares regression model
2. Compute the standard error of the estimate
3. Verify that residuals are normally distributed
4. Test the claim that a linear relation exists between two variables
5. Construct and interpret a confidence interval about the slope of the least-squares regression model
14.2 Confidence and Prediction Intervals
1. Construct and interpret confidence intervals for a mean response about a predicted value
2. Construct and interpret prediction intervals for an individual observation about a predicted value
14.3 Multiple Linear Regression
1. Obtain the correlation matrix
2. Use technology to find the multiple regression model
3. Interpret the coefficients of the multiple regression model
4. Determine R2 and adjusted R2
5. Perform an F-test for lack of fit using the P-value approach
6. Test individual regression coefficients for significance
7. Construct and interpret confidence and prediction intervals
8. Build a regression model
Chapter Review
Case Study
Chapter 15 Nonparametrics (ON CD)
15.1 An Overview of Nonparametric Statistics
1. Understand the difference between parametric statistical procedures and nonparametric statistical procedures
15.2 Runs Test for Randomness
1. Perform a runs test for randomness
15.3 Inferences about Measures of Central Tendency
1. Conduct a one-sample sign test
15.4 Inferences about the Difference between Two Measures of Central Tendency: Dependent Samples
1. Test a claim regarding the difference between two medians of dependent samples
15.5 Inferences about the Difference between Two Measures of Central Tendency: Independent Samples
1. Test a claim regarding the difference between two medians of independent samples
15.6 Spearman’s Rank-Correlation Test
1. Perform Spearman’s rank-correlation test
15.7 Kruskal-Wallis Test of One-way Analysis of Variance
1. Test a claim regarding three or more populations using the Kruskal-Wallis test
Chapter Review
Case Study
Appendix A Tables
Appendix B Lines (On CD)
1. Calculate and interpret the slope of a line
2. Graph lines given a point and the slope
3. Use the point-slope form of a line; identify horizontal lines
4. Find the equation of a line given two points
5. Write the equation of a line in slope-intercept form
6. Identify the slope and y-intercept of a line from its equation
Answers
Index
| Erscheint lt. Verlag | 16.3.2006 |
|---|---|
| Sprache | englisch |
| Maße | 214 x 279 mm |
| Gewicht | 2146 g |
| Themenwelt | Mathematik / Informatik ► Mathematik ► Statistik |
| ISBN-10 | 0-13-187149-8 / 0131871498 |
| ISBN-13 | 978-0-13-187149-6 / 9780131871496 |
| Zustand | Neuware |
| Haben Sie eine Frage zum Produkt? |
aus dem Bereich

