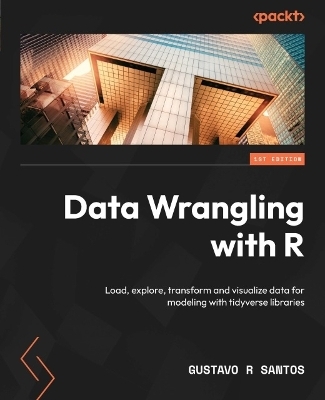
Data Wrangling with R
Packt Publishing Limited (Verlag)
978-1-80323-540-0 (ISBN)
Take your data wrangling skills to the next level by gaining a deep understanding of tidyverse libraries and effectively prepare your data for impressive analysis
Purchase of the print or Kindle book includes a free PDF eBook
Key Features
Explore state-of-the-art libraries for data wrangling in R and learn to prepare your data for analysis
Find out how to work with different data types such as strings, numbers, date, and time
Build your first model and visualize data with ease through advanced plot types and with ggplot2
Book DescriptionIn this information era, where large volumes of data are being generated every day, companies want to get a better grip on it to perform more efficiently than before. This is where skillful data analysts and data scientists come into play, wrangling and exploring data to generate valuable business insights. In order to do that, you'll need plenty of tools that enable you to extract the most useful knowledge from data.
Data Wrangling with R will help you to gain a deep understanding of ways to wrangle and prepare datasets for exploration, analysis, and modeling. This data book enables you to get your data ready for more optimized analyses, develop your first data model, and perform effective data visualization.
The book begins by teaching you how to load and explore datasets. Then, you'll get to grips with the modern concepts and tools of data wrangling. As data wrangling and visualization are intrinsically connected, you'll go over best practices to plot data and extract insights from it. The chapters are designed in a way to help you learn all about modeling, as you will go through the construction of a data science project from end to end, and become familiar with the built-in RStudio, including an application built with Shiny dashboards.
By the end of this book, you'll have learned how to create your first data model and build an application with Shiny in R.
What you will learn
Discover how to load datasets and explore data in R
Work with different types of variables in datasets
Create basic and advanced visualizations
Find out how to build your first data model
Create graphics using ggplot2 in a step-by-step way in Microsoft Power BI
Get familiarized with building an application in R with Shiny
Who this book is forIf you are a professional data analyst, data scientist, or beginner who wants to learn more about data wrangling, this book is for you. Familiarity with the basic concepts of R programming or any other object-oriented programming language will help you to grasp the concepts taught in this book. Data analysts looking to improve their data manipulation and visualization skills will also benefit immensely from this book.
Gustavo R Santos has worked in the Technology Industry for 13 years, improving processes, and analyzing datasets and creating dashboards. Since 2020, he has been working as a Data Scientist in the retail industry, wrangling, analyzing, visualizing and modeling data with the most modern tools like R, Python and Databricks. Gustavo also gives lectures from time to time at an online school about Data Science concepts. He has a background in Marketing, is certified as Data Scientist by the Data Science Academy Brazil and pursues his specialist MBA in Data Science at the University of Sao Paulo
Table of Contents
Fundamentals of Data Wrangling
Load & Explore Datasets
Basic Data Visualization
Working with Strings
Working with Numbers
Working with Date and Time objects
Transformations with Base R
Transformations with tidyverse libraries
Exploratory Data Analysis
Introduction to ggplot2
Enhanced Visualizations with ggplot2
Other Data Visualization Options
Build Your First Model
Build an Application with Shiny in R
| Erscheinungsdatum | 24.02.2023 |
|---|---|
| Verlagsort | Birmingham |
| Sprache | englisch |
| Maße | 75 x 93 mm |
| Themenwelt | Informatik ► Datenbanken ► Data Warehouse / Data Mining |
| Mathematik / Informatik ► Informatik ► Theorie / Studium | |
| ISBN-10 | 1-80323-540-3 / 1803235403 |
| ISBN-13 | 978-1-80323-540-0 / 9781803235400 |
| Zustand | Neuware |
| Informationen gemäß Produktsicherheitsverordnung (GPSR) | |
| Haben Sie eine Frage zum Produkt? |
aus dem Bereich


