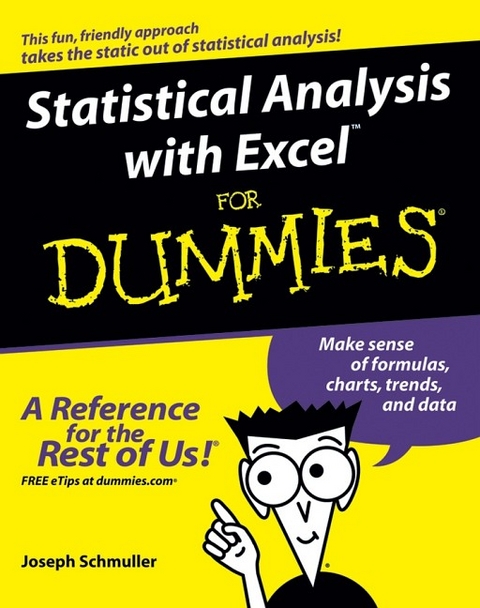
Statistical Analysis with Excel For Dummies
Hungry Minds Inc,U.S. (Verlag)
978-0-7645-7594-5 (ISBN)
- Titel erscheint in neuer Auflage
- Artikel merken
* This book makes it easy to crunch numbers and interpret statistics with Excel, even for the math-challenged * Using plain English and real-life examples, the author provides information that will help readers improve their performance on the job or in the classroom * Covers formulas and functions, charts and PivotTables, samples and normal distributions, probabilities and related distributions, trends and correlations, as well as statistical terms like median vs. mean, margin of error, standard deviation, permutations, and correlations-all using Excel
A veteran of over twenty years in Information Technology, Joseph Schmuller is a Technical Architect at Blue Cross-Blue Shield of Florida. He is the author of several books on computing, including the three editions of Teach Yourself UML in 24 Hours (SAMS), and he has written numerous articles on advanced technology. From 1991 through 1997, he was Editor-in-Chief of PC AI magazine. He is a former member of the American Statistical Association, and he has taught statistics at the undergraduate and graduate levels. He holds a B.S. from Brooklyn College, an M.A. from the University of Missouri-Kansas City, and a Ph.D. from the University of Wisconsin. He and his family live in Jacksonville, Florida, where he is an Adjunct Professor at the University of North Florida.
Introduction.Part I: Statistics and Excel: A Marriage Made in Heaven.Chapter 1: Evaluating Data in the Real World.Chapter 2: Understanding Excel's Statistical Capabilities.Part II: Describing Data.Chapter 3: Show and Tell: Graphing Data.Chapter 4: Finding Your Center.Chapter 5: Deviating from the Average.Chapter 6: Meeting Standards and Standings.Chapter 7: Summarizing It All.Chapter 8: What's Normal?Part III: Drawing Conclusions from Data.Chapter 9: The Confidence Game: Estimation.Chapter 10: One-Sample Hypothesis Testing.Chapter 11: Two-Sample Hypothesis Testing.Chapter 12: Testing More than Two Samples.Chapter 13: Slightly More Complicated Testing.Chapter 14: Regression: Linear and Multiple.Chapter 15: Correlation: The Rise and Fall of Relationships.Part IV: Working with Probability.Chapter 16: Introducing Probability.Chapter 17: More on Probability.Chapter 18: A Career in Modeling.Part V: The Part of Tens.Chapter 19: Ten Statistical and Graphical Tips and Traps.Chapter 20: Ten (Or so) Things That Didn't Fit in Any Other Chapter.Appendix: When Your Worksheet is a Database.Index.
| Erscheint lt. Verlag | 4.3.2005 |
|---|---|
| Zusatzinfo | Illustrations |
| Verlagsort | Foster City |
| Sprache | englisch |
| Maße | 190 x 236 mm |
| Gewicht | 582 g |
| Einbandart | Paperback |
| Themenwelt | Informatik ► Office Programme ► Excel |
| Mathematik / Informatik ► Mathematik ► Statistik | |
| Mathematik / Informatik ► Mathematik ► Wahrscheinlichkeit / Kombinatorik | |
| ISBN-10 | 0-7645-7594-5 / 0764575945 |
| ISBN-13 | 978-0-7645-7594-5 / 9780764575945 |
| Zustand | Neuware |
| Haben Sie eine Frage zum Produkt? |
aus dem Bereich


