Using R for Introductory Statistics
Chapman & Hall/CRC (Verlag)
978-1-58488-450-7 (ISBN)
- Titel erscheint in neuer Auflage
- Artikel merken
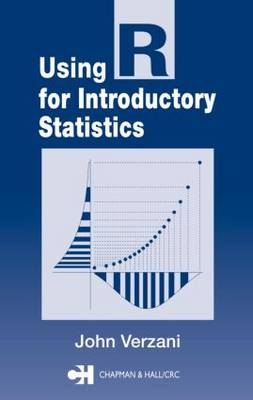
The cost of statistical computing software has precluded many universities from installing these valuable computational and analytical tools. R, a powerful open-source software package, was created in response to this issue. It has enjoyed explosive growth since its introduction, owing to its coherence, flexibility, and free availability. While it is a valuable tool for students who are first learning statistics, proper introductory materials are needed for its adoption.
Using R for Introductory Statistics fills this gap in the literature, making the software accessible to the introductory student. The author presents a self-contained treatment of statistical topics and the intricacies of the R software. The pacing is such that students are able to master data manipulation and exploration before diving into more advanced statistical concepts. The book treats exploratory data analysis with more attention than is typical, includes a chapter on simulation, and provides a unified approach to linear models.
This text lays the foundation for further study and development in statistics using R. Appendices cover installation, graphical user interfaces, and teaching with R, as well as information on writing functions and producing graphics. This is an ideal text for integrating the study of statistics with a powerful computational tool.
DATA
What Is Data?
Some R Essentials
Accessing Data by Using Indices
Reading in Other Sources of Data
UNIVARIATE DATA
Categorical Data
Numeric Data
Shape of a Distribution
BIVARIATE DATA
Pairs of Categorical Variables
Comparing Independent Samples
Relationships in Numeric Data
Simple Linear Regression
MULTIVARIATE DATA
Viewing Multivariate Data
R Basics: Data Frames and Lists
Using Model Formula with Multivariate Data
Lattice Graphics
Types of Data in R
DESCRIBING POPULATIONS
Populations
Families of Distributions
The Central Limit Theorem
SIMULATION
The Normal Approximation for the Binomial
for loops
Simulations Related to the Central Limit Theorem
Defining a Function
Investigating Distributions
Bootstrap Samples
Alternates to for loops
CONFIDENCE INTERVALS
Confidence Interval Ideas
Confidence Intervals for a Population Proportion, p
Confidence Intervals for the Population Mean, µ
Other Confidence Intervals
Confidence Intervals for Differences
Confidence Intervals for the Median
SIGNIFICANCE TESTS
Significance Test for a Population Proportion
Significance Test for the Mean (t-Tests)
Significance Tests and Confidence Intervals
Significance Tests for the Median
Two-Sample Tests of Proportion
Two-Sample Tests of Center
GOODNESS OF FIT
The Chi-Squared Goodness-of-Fit Test
The Chi-Squared Test of Independence
Goodness-of-Fit Tests for Continuous Distributions
LINEAR REGRESSION
The Simple Linear Regression Model
Statistical Inference for Simple Linear Regression
Multiple Linear Regression
ANALYSIS OF VARIANCE
One-Way ANOVA
Using lm() for ANOVA
ANCOVA
Two-Way ANOVA
TWO EXTENSIONS OF THE LINEAR MODEL
Logistic Regression
Nonlinear Models
APPENDIX A: GETTING, INSTALLING, AND RUNNING R
Installing and Starting R
Extending R Using Additional Packages
APPENDIX B: GRAPHICAL USER INTERFACES AND R
The Windows GUI
The Mac OS X GUI
Rcdmr
APPENDIX C: TEACHING WITH R
APPENDIX D: MORE ON GRAPHICS WITH R
Low- and High-Level Graphic Functions
Creating New Graphics in R
APPENDIX E: PROGRAMMING IN R
Editing Functions
Using Functions
Using Files and a Better Editor
Object-Oriented Programming with R
INDEX
| Erscheint lt. Verlag | 29.11.2004 |
|---|---|
| Reihe/Serie | Chapman & Hall/CRC: The R Series |
| Zusatzinfo | 56 Tables, black and white; 104 Illustrations, black and white |
| Sprache | englisch |
| Maße | 156 x 235 mm |
| Gewicht | 726 g |
| Themenwelt | Mathematik / Informatik ► Mathematik ► Computerprogramme / Computeralgebra |
| ISBN-10 | 1-58488-450-9 / 1584884509 |
| ISBN-13 | 978-1-58488-450-7 / 9781584884507 |
| Zustand | Neuware |
| Haben Sie eine Frage zum Produkt? |
aus dem Bereich


