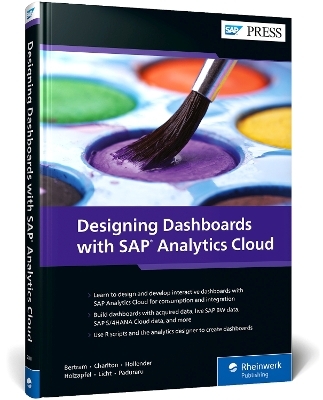
Designing Dashboards with SAP Analytics Cloud
SAP Press (Verlag)
978-1-4932-2060-1 (ISBN)
SAP Analytics Cloud is overflowing with visualization options. Charts, tables, drilldowns, geomaps—if you can dream it, you can design and build it. Learn how to create a dashboard for any use case, from acquired data dashboards and responsive mobile dashboards to HR dashboards using SAP SuccessFactors data. Follow step-by-step instructions to structure your data, choose the relevant features, and then implement them. Contains custom-designed dashboards for each chapter!Highlights include:1) Dashboard design 2) Live data connections3) Acquired data dashboards 4) Planning dashboards 5) Responsive mobile dashboards6) SAP SuccessFactors dashboards7) Qualtrics dashboards8) R visualizations9) Analytics designer10) SAP Digital Boardroom
Erik Bertram is a software developer who currently leads the Global Design Operations and Services team in the HANA and Analytics organization at SAP. He is responsible for all kinds of customer engagements and operational activities. Before joining SAP in 2016, Erik was working as a postdoctoral researcher at Heidelberg University. He holds a PhD in theoretical astrophysics. James Charlton has clocked up a quarter of a century in user assistance, and has spent a lot of that time with SAP in the data modeling, business intelligence, and predictive analytics fields. When he isn't writing technical content, you'll find him scribbling poetry, short stories, playing blues piano, or fixing up something. Nina Hollender is an experienced user researcher in the HANA & Analytics organization at SAP. She joined SAP in 2011 and conducted various user research projects in the analytics area, from self-service BI to advanced analytics. She is passionate about learning from the different users of SAP’s products. Before joining SAP, Nina conducted research on information processing and visualization and holds a PhD in psychology.|Melanie Holzapfel is a data scientist in the HANA & Analytics organization at SAP. She joined SAP in 2019 after finishing her physics studies at Heidelberg University. At SAP, she is responsible for analyzing customer feedback and building dashboards with suitable data visualization graphics.|Nico Licht is an experienced designer (interaction design, design thinking, media production) with more than 20 years of design experience, 10 years of software development experience, and 5 years cloud software development experience in the fields of data management, analytics, and planning. He leads a global team of domain experts (user experience, user assistance and design services) and holds an audio-visual media engineering degree from Stuttgart Media University. Carmen Paduraru joined SAP in 2015 working on core database administration topics and engaging with users to understand their tool landscape, workflows, use cases, and ultimately their overall experience with the SAP HANA tools and SAP Analytics Cloud. She strongly believes that a research and design-led development is the best way to achieve an optimal UX. Her background is in experimental psycholinguistics, which is part of the field of cognitive science. Before joining SAP, she worked on quantitative research projects designing studies, collecting data, analyzing, and visualizing it.
| Erscheinungsdatum | 01.09.2021 |
|---|---|
| Reihe/Serie | SAP PRESS Englisch |
| Verlagsort | Maryland |
| Sprache | englisch |
| Maße | 185 x 260 mm |
| Gewicht | 862 g |
| Themenwelt | Mathematik / Informatik ► Informatik ► Netzwerke |
| Informatik ► Weitere Themen ► SAP | |
| Schlagworte | Project Orca • SAP BOC • SAP BO Cloud • SAP BusinessObjects Cloud • SAP C4A • SAP Cloud for Analytics • SAP SAC |
| ISBN-10 | 1-4932-2060-8 / 1493220608 |
| ISBN-13 | 978-1-4932-2060-1 / 9781493220601 |
| Zustand | Neuware |
| Informationen gemäß Produktsicherheitsverordnung (GPSR) | |
| Haben Sie eine Frage zum Produkt? |
aus dem Bereich


