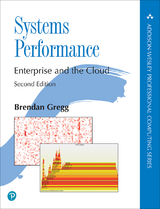
Systems Performance
Pearson (Verlag)
978-0-13-682015-4 (ISBN)
- Titel nicht im Sortiment
- Artikel merken
Systems performance expert and best-selling author Brendan Gregg summarizes relevant operating system, hardware, and application theory to quickly get professionals up to speed even if they've never analyzed performance before. Gregg then provides in-depth explanations of the latest tools and techniques, including extended BPF, and shows how to get the most out of cloud, web, and large-scale enterprise systems. Key topics covered include
Hardware, kernel, and application internals, and how they perform
Methodologies for rapid performance analysis of complex systems
Optimizing CPU, memory, file system, disk, and networking usage
Sophisticated profiling and tracing with perf, Ftrace, and BPF (BCC and bpftrace)
Performance challenges associated with cloud computing hypervisors
Benchmarking more effectively
Featuring up-to-date coverage of Linux operating systems and environments, Systems Performance, Second Edition, also addresses issues that apply to any computer system. The book will be a go-to reference for many years to come and, like the first edition, required reading at leading tech companies.
Register your book for convenient access to downloads, updates, and/or corrections as they become available. See inside book for details.
Brendan Gregg is an industry expert in computing performance and cloud computing. He is a senior performance architect at Netflix, where he does performance design, evaluation, analysis, and tuning. The author of multiple technical books including BPF Performance Tools and Systems Performance, he received the USENIX LISA Award for Outstanding Achievement in System Administration. He has also been a kernel engineer and performance lead, and was program co-chair for the USENIX LISA 2018 conference. He has created performance tools included in multiple operating systems, and visualizations and methodologies for performance analysis, including flame graphs.
Preface xxix
Acknowledgments xxxv
About the Author xxxvii
Chapter 1: Introduction 1
1.1 Systems Performance 1
1.2 Roles 2
1.3 Activities 3
1.4 Perspectives 4
1.5 Performance Is Challenging 5
1.6 Latency 6
1.7 Observability 7
1.8 Experimentation 13
1.9 Cloud Computing 14
1.10 Methodologies 15
1.11 Case Studies 16
1.12 References 19
Chapter 2: Methodologies 21
2.1 Terminology 22
2.2 Models 23
2.3 Concepts 24
2.4 Perspectives 37
2.5 Methodology 40
2.6 Modeling 62
2.7 Capacity Planning 69
2.8 Statistics 73
2.9 Monitoring 77
2.10 Visualizations 79
2.11 Exercises 85
2.12 References 86
Chapter 3: Operating Systems 89
3.1 Terminology 90
3.2 Background 91
3.3 Kernels 111
3.4 Linux 114
3.5 Other Topics 122
3.6 Kernel Comparisons 124
3.7 Exercises 124
3.8 References 125
Chapter 4: Observability Tools 129
4.1 Tool Coverage 130
4.2 Tool Types 133
4.3 Observability Sources 138
4.4 sar 160
4.5 Tracing Tools 166
4.6 Observing Observability 167
4.7 Exercises 168
4.8 References 168
Chapter 5: Applications 171
5.1 Application Basics 172
5.2 Application Performance Techniques 176
5.3 Programming Languages 182
5.4 Methodology 186
5.5 Observability Tools 199
5.6 Gotchas 213
5.7 Exercises 216
5.8 References 217
Chapter 6: CPUs 219
6.1 Terminology 220
6.2 Models 221
6.3 Concepts 223
6.4 Architecture 229
6.5 Methodology 244
6.6 Observability Tools 254
6.7 Visualizations 288
6.8 Experimentation 293
6.9 Tuning 294
6.10 Exercises 299
6.11 References 300
Chapter 7: Memory 303
7.1 Terminology 304
7.2 Concepts 305
7.3 Architecture 311
7.4 Methodology 323
7.5 Observability Tools 328
7.6 Tuning 350
7.7 Exercises 354
7.8 References 355
Chapter 8: File Systems 359
8.1 Terminology 360
8.2 Models 361
8.3 Concepts 362
8.4 Architecture 372
8.5 Methodology 383
8.6 Observability Tools 391
8.7 Experimentation 411
8.8 Tuning 414
8.9 Exercises 419
8.10 References 420
Chapter 9: Disks 423
9.1 Terminology 424
9.2 Models 425
9.3 Concepts 427
9.4 Architecture 435
9.5 Methodology 449
9.6 Observability Tools 458
9.7 Visualizations 487
9.8 Experimentation 490
9.9 Tuning 493
9.10 Exercises 495
9.11 References 496
Chapter 10: Network 499
10.1 Terminology 500
10.2 Models 501
10.3 Concepts 503
10.4 Architecture 509
10.5 Methodology 524
10.6 Observability Tools 533
10.7 Experimentation 562
10.8 Tuning 567
10.9 Exercises 574
10.10 References 575
Chapter 11: Cloud Computing 579
11.1 Background 580
11.2 Hardware Virtualization 587
11.3 OS Virtualization 605
11.4 Lightweight Virtualization 630
11.5 Other Types 634
11.6 Comparisons 634
11.7 Exercises 636
11.8 References 637
Chapter 12: Benchmarking 641
12.1 Background 642
12.2 Benchmarking Types 651
12.3 Methodology 656
12.4 Benchmark Questions 667
12.5 Exercises 668
12.6 References 669
Chapter 13: perf 671
13.1 Subcommands Overview 672
13.2 One-Liners 674
13.3 perf Events 679
13.4 Hardware Events 681
13.5 Software Events 683
13.6 Tracepoint Events 684
13.7 Probe Events 685
13.8 perf stat 691
13.9 perf record 694
13.10 perf report 696
13.11 perf script 698
13.12 perf trace 701
13.13 Other Commands 702
13.14 perf Documentation 703
13.15 References 703
Chapter 14: Ftrace 705
14.1 Capabilities Overview 706
14.2 tracefs (/sys) 708
14.3 Ftrace Function Profiler 711
14.4 Ftrace Function Tracing 713
14.5 Tracepoints 717
14.6 kprobes 719
14.7 uprobes 722
14.8 Ftrace function_graph 724
14.9 Ftrace hwlat 726
14.10 Ftrace Hist Triggers 727
14.11 trace-cmd 734
14.12 perf ftrace 741
14.13 perf-tools 741
14.14 Ftrace Documentation 748
14.15 References 749
Chapter 15: BPF 751
15.1 BCC 753
15.2 bpftrace 761
15.3 References 782
Chapter 16: Case Study 783
16.1 An Unexplained Win 783
16.2 Additional Information 792
16.3 References 793
Appendix A: USE Method: Linux 795
Appendix B: sar Summary 801
Appendix C: bpftrace One-Liners 803
Appendix D: Solutions to Selected Exercises 809
Appendix E: Systems Performance Who's Who 811
Glossary 815
Index 825
| Erscheinungsdatum | 08.01.2021 |
|---|---|
| Reihe/Serie | Addison-Wesley Professional Computing Series |
| Verlagsort | Upper Saddle River |
| Sprache | englisch |
| Gewicht | 1410 g |
| Themenwelt | Informatik ► Betriebssysteme / Server ► Unix / Linux |
| ISBN-10 | 0-13-682015-8 / 0136820158 |
| ISBN-13 | 978-0-13-682015-4 / 9780136820154 |
| Zustand | Neuware |
| Informationen gemäß Produktsicherheitsverordnung (GPSR) | |
| Haben Sie eine Frage zum Produkt? |
aus dem Bereich


