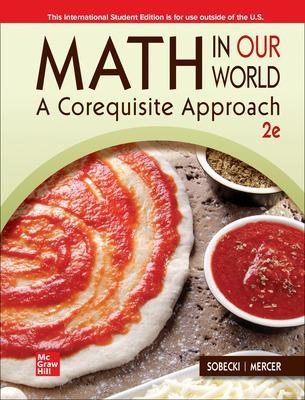
ISE MATH IN OUR WORLD: A COREQUISITE APPROACH
McGraw-Hill Education (Verlag)
978-1-260-57517-0 (ISBN)
- Titel z.Zt. nicht lieferbar
- Versandkostenfrei innerhalb Deutschlands
- Auch auf Rechnung
- Verfügbarkeit in der Filiale vor Ort prüfen
- Artikel merken
I was born and raised in Cleveland, and started college at Bowling Green State University in 1984 majoring in creative writing. Eleven years later, I walked across the graduation stage to receive a PhD in math, a strange journey indeed. After two years at Franklin and Marshall College in Pennsylvania, I came home to Ohio, accepting a tenure-track job at the Hamilton campus of Miami University. Ive won a number of teaching awards in my career, and while maintaining an active teaching schedule, I now spend an inordinate amount of time writing textbooks and course materials. Ive written or co-authored either seven or twelve textbooks, depending on how you count them, as well as several solutions manuals and interactive CD-ROMS. After many years as developmental math coordinator at Miami Hamilton, I share the frustration that goes along with low pass rates in the developmental math curriculum. Far too many students end up on the classic Jetsons-style treadmill, with the abstract nature of the traditional algebra curriculum keeping them from reaching their goals. Like so many instructors across the country, I believe the time is right to move beyond the one-size-fits-all curriculum that treats students the same whether they hope to be an engineer or a pastry chef. Because weve always done it that way is NOT a good reason to maintain the status quo in our curriculum. Lets work together to devise alternate pathways that help students to learn more and learn better while hastening their trip into credit-bearing math courses. Since my book (Math in Our World) is written for the Liberal Arts Math and Quantitative Literacy market, I think Im in the right place at the right time to make a difference in the new and exciting pathways course. Im in a very happy place right now: my love of teaching meshes perfectly with my childhood dream of writing. (Dont tell my publisher this they think I spend 20 hours a day working on textbooks but Im working on my first novel in the limited spare time that I have.) Im also a former coordinator of Ohio Project NExT, as I believe very strongly in helping young college instructors focus on high-quality teaching as a primary career goal. I live in Fairfield, Ohio with my lovely wife Cat and fuzzy dogs Macleod and Tessa. When not teaching or writing, my passions include Ohio State football, Cleveland Indians baseball, heavy metal music, travel, golf, and home improvement. I can say without a doubt that I was made to be in a classroom. I followed the footsteps of my father, a 35-year middle school math teaching veteran, into this challenging yet rewarding career. My college experience began as a community college student at Lakeland College in Mattoon, Illinois. From there, I received a Bachelor of Science in Mathematics from Eastern Illinois University and a Master of Science in Mathematics from Southern Illinois University. I accepted a tenure-track faculty position at Parkland College, where I have taught developmental and college-level courses for 15 years. I had the opportunity to begin writing textbooks shortly after I started teaching at Parkland. My then department chair and mentor, James W. Hall, and I co-authored several textbooks in Beginning and Intermediate Algebra. In the fall of 2011, our department began discussing the idea of creating two tracks through our beginning and intermediate algebra courses. The idea stemmed from two issues. First, most of our beginning and intermediate algebra students were headed to either our Liberal Arts Math or our Introduction to Statistics course. Second, we wanted to beef up intermediate algebra to better prepare those students who were headed to college algebra. These were two competing ideas! Increasing the algebraic rigor of these courses seemed to punish students who were not heading to college algebra. With the two track system, we implemented a solution that best serves both groups of students. I have to admit that I was initially concerned that offering an alternate path through developmental mathematics for students not planning to take college algebra would lead to a lowering of standards. However, my participation in our committee investigating this idea led me to believe it was possible to offer a rigorous course that was exceedingly more appropriate for this group of students. Since there were no materials for the course, I began creating my own and was paired by McGraw Hill with Dave Sobecki. Together, we have created the material that I have been using for class testing. After a semester and a half of piloting these materials and seeing the level of enthusiasm and engagement in the mathematical conversations of my students, I am now convinced that this is an ideal course to refine and offer. As a trusted colleague told me, this is just a long overdue idea. Outside of the classroom and away from the computer, I am kept educated, entertained and ever-busy my wonderful wife, Nikki, and our two children, Charlotte, 6 and Jake, 5. I am an avid St. Louis Cardinals fan and enjoy playing recreational softball and golf in the summertime with colleagues and friends.
Unit 1: THE IMPORTANCE OF BEING NUMERATE
Lesson 1-1: Giving 110 Percent (Review of Percents)
Objective 1: Perform conversions and calculations involving percents.
Objective 2: Find percent increase or decrease.
Objective 3: Solve problems using percents.
Objective 4: Evaluate the legitimacy of claims based on percents.
Lesson 1-2: Where Does the Time Go? (Drawing and Interpreting Pie Charts and Bar Graphs)
Objective 1: Analyze personal time management for a week of activities.
Objective 2: Solve problems involving percentages.
Objective 3: Create and interpret pie charts.
Objective 4: Create and interpret bar graphs.
Lesson 1-3: Take a Guess! (Estimation and Number Sense)
Objective 1: Identify the steps in a systematic problem-solving procedure.
Objective 2: Make educated guesses.
Objective 3: Compare numbers using inequality symbols.
Lesson 1-4: It Works Like Magic (Dimensional Analysis)
Objective 1: Convert units using dimensional analysis.
Objective 2: Convert units within the metric system.
Objective 3: Convert rates of change.
Objective 4: Convert temperatures.
Lesson 1-5: It’s All Relative (Interpreting Relative Difference/Relative Error)
Objective 1: Compare change to relative change.
Objective 2: Apply percent error.
Lesson 1-6: Debt: Bad. Chocolate: Good (Using Scientific Notation)
Objective 1: Convert numbers between decimal and scientific notation.
Objective 2: Describe the significance of writing numbers in scientific notation.
Lesson 1-7: Portion Control (Apportionment)
Objective 1: Describe what apportionment is and why it’s used.
Objective 2: Compute standard divisors and quotas.
Objective 3: Apportion items using a variety of methods.
Unit 2: CONTENDING WITH CHANGE
Lesson 2-1: Avoiding Empty Pockets (Comparing Linear and Exponential Growth)
Objective 1: Distinguish between simple interest and compound interest.
Objective 2: Distinguish between linear and exponential growth.
Objective 3: Interpret exponents as repeated multiplication.
Objective 4: Simplify numeric expressions involving exponents and the order of operations.
Lesson 2-2: A Coordinated Effort (The Basics of Graphing)
Objective 1: Use a rectangular coordinate system.
Objective 2: Connect data to graphs.
Objective 3: Interpret graphs.
Lesson 2-3: 88 Miles Per Hour! (Slope as a Rate of Change)
Objective 1: Interpret a rate of change.
Objective 2: Predict a future value from a rate of change.
Objective 3: Calculate a rate of change.
Objective 4: Find the intercepts of a line.
Objective 5: Interpret the meaning of the intercepts of a line.
Lesson 2-4: The Effects of Alcohol (Slope-Intercept Form and Linear Modeling)
Objective 1: Write an equation of a line given a description of the relationship.
Objective 2: Write an equation of a line that models data from a table.
Objective 3: Write an equation of a line from a graph of the line.
Objective 4: Graph a line by plotting points.
Lesson 2-5: The Great Tech Battle (Linear Relationships and Lines of Best Fit)
Objective 1: Determine whether two variables have a linear relationship.
Objective 2: Calculate the line of best fit for a set of data using a spreadsheet.
Objective 3: Calculate the line of best fit for a set of data using a calculator.
Objective 4: Interpret the correlation coefficient for a data set.
Lesson 2-6: Sit Back and Watch Your Money Grow (Exponential Growth Equations)
Objective 1: Define function and use function notation.
Objective 2: Identify the significance of a and b in an equation of the form y = abx
Objective 3: Find exponential models.
Objective 4: Compare exponential models using graphs, tables, and formulas.
Lesson 2-7: Follow the Bouncing Golf Ball (Exponential Curve Fitting)
Objective 1: Gather and organize data from an experiment.
Objective 2: Find an exponential curve of best fit for an experimental data set.
Objective 3: Study the decay rate for exponential decay.
Lesson 2-8: Keeping Current (Modeling Current Data with Linear or Exponential Equations)
Objective 1: Decide on an appropriate type of model for a given data set.
Objective 2: Model data with a linear or exponential equation.
Objective 3: Research current data to compare to values predicted by a model.
Unit 3: MANAGING YOUR MONEY
Lesson 3-1: A Topic of Interest (Simple Interest)
Objective 1: Define interest and understand related terminology.
Objective 2: Develop simple interest formulas.
Objective 3: Use simple interest formulas to analyze financial issues.
Lesson 3-2: Like a Snowball Rolling Downhill (Compound Interest)
Objective 1: Describe how compound interest differs from simple interest.
Objective 2: Develop compound interest formulas.
Objective 3: Use compound interest formulas to analyze financial issues.
Lesson 3-3: Buying Stuff Without Money (Installment Buying)
Objective 1: Compute payments and charges associated with installment loans.
Objective 2: Identify the true cost of a loan by computing APR.
Objective 3: Evaluate the costs of buying items on credit.
Lesson 3-4: Investing in Yourself (Education and Home Loans)
Objective 1: Understand different student loan options.
Objective 2: Compute interest and monthly payments on a student loan.
Objective 3: Evaluate the effects of capitalizing interest.
Objective 4: Analyze various aspects of a mortgage.
Objective 5: Compare two mortgages of different lengths.
Objective 6: Prepare an amortization schedule.
Lesson 3-5: A Walk on Wall Street (Stocks and Bonds)
Objective 1: Read information from a stock listing.
Objective 2: Calculate costs of buying stock, and profit or loss from selling.
Objective 3: Study the price-to-earnings ratio, and use it to analyze the value of a stock.
Objective 4: Calculate profit from a bond sale.
Lesson 3-6: A Taxing Situation (Income Taxes)
Objective 1: Understand why we pay taxes.
Objective 2: Explain the basic process of paying taxes.
Objective 3: Determine the amount of tax due based on taxable income.
Objective 4: Complete a 1040 form.
Unit 4: STATISTICALLY SPEAKING
Lesson 4-1: So You’re Saying There’s a Chance . . . (Basic Probability)
Objective 1: Understand key terminology in the study of probability.
Objective 2: Compute and interpret theoretical and empirical probabilities.
Objective 3: Compare theoretical and empirical probability.
Lesson 4-2: Make It Count (Sample Spaces and Counting Techniques)
Objective 1: Describe how counting techniques are useful in probability theory.
Objective 2: Use tree diagrams and tables to determine sample spaces and compute probabilities.
Objective 3: Develop and use the fundamental counting principle.
Lesson 4-3: Odds and Ends (Odds and Expected Value)
Objective 1: Distinguish between odds and probability.
Objective 2: Compute and interpret the odds in favor of and odds against an event.
Objective 3: Compute odds from probability and vice versa.
Objective 4: Develop a procedure for finding expected value.
Objective 5: Compute and interpret expected values.
Lesson 4-4: Crunching the Numbers (Gathering and Organizing Data)
Objective 1: Explain the difference between a population and a sample.
Objective 2: Compare and contrast different sampling methods.
Objective 3: Organize data with frequency distributions.
Objective 4: Analyze data with stem and leaf plots.
Lesson 4-5: An Average Joe (Measures of Average)
Objective 1: Compute measures of average for given data.
Objective 2: Interpret the story told by measures of average.
Objective 3: Compute and interpret the mean for grouped data.
Objective 4: Compute weighted grades.
Objective 5: Use technology to compute measures of average.
Lesson 4-6: Your Results May Vary (Measures of Variation)
Objective 1: Compute measures of variation for a given data set.
Objective 2: Interpret standard deviation for a data set.
Objective 3: Make meaningful comparisons of standard deviation for two data sets.
Objective 4: Analyze the procedure for computing standard deviation.
Lesson 4-7: Just a Normal Day (Normal Distributions and Z Scores)
Objective 1: Recognize characteristics of data that are normally distributed.
Objective 2: Understand the connection between area under a normal curve, percentage, and probability.
Objective 3: Make an educated guess about the empirical rule, then use the rule to calculate percentages and probabilities.
Objective 4: Compare data values from different sets using Z scores.
Lesson 4-8: The Error of Your Ways (Polling and Margin of Error)
Objective 1: Determine the margin of error in a given poll.
Objective 2: Explain the meaning of the margin of error in a given poll.
Objective 3: Calculate the number of poll respondents needed for a given margin of error.
Lesson 4-9: Trust No One (Misuses of Statistics)
Objective 1: Identify misuses of sampling and evaluate their effect on statistical results.
Objective 2: Recognize and describe common misuses of compiling and reporting statistics that make them meaningless or deceiving.
Objective 3: Study ways that graphs can be manipulated to tell a desired story.
| Erscheint lt. Verlag | 8.12.2020 |
|---|---|
| Zusatzinfo | 1663 Illustrations, unspecified |
| Verlagsort | OH |
| Sprache | englisch |
| Themenwelt | Mathematik / Informatik ► Mathematik ► Allgemeines / Lexika |
| ISBN-10 | 1-260-57517-9 / 1260575179 |
| ISBN-13 | 978-1-260-57517-0 / 9781260575170 |
| Zustand | Neuware |
| Haben Sie eine Frage zum Produkt? |
aus dem Bereich


