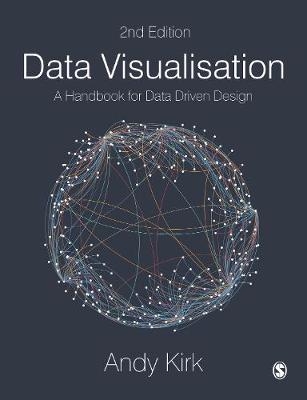
Data Visualisation
SAGE Publications Ltd (Verlag)
978-1-5264-6892-5 (ISBN)
One of the "six best books for data geeks" - Financial Times
With over 200 images and extensive how-to and how-not-to examples, this new edition has everything students and scholars need to understand and create effective data visualisations.
Combining ‘how to think’ instruction with a ‘how to produce’ mentality, this book takes readers step-by-step through analysing, designing, and curating information into useful, impactful tools of communication.
With this book and its extensive collection of online support, readers can:
Decide what visualisations work best for their data and their audience using the chart gallery
See data visualisation in action and learn the tools to try it themselves
Follow online checklists, tutorials, and exercises to build skills and confidence
Get advice from the UK’s leading data visualisation trainer on everything from getting started to honing the craft.
Andy Kirk is a UK-based data visualisation expert who has been working as a freelance professional offering consultancy, design and education services since 2010 worldwide. Andy works as a data visualisation design consultant, educator, author, researcher and speaker. He is the editor of visualisingdata.com and hosts the ‘Explore Explain’ video and podcast series. After graduating from Lancaster University in 1999 with a BSc (hons) in Operational Research, Andy’s working career commenced in a series of business analysis/information management roles with organisations including CIS Insurance, West Yorkshire Police and the University of Leeds.
INTRODUCTION
PART A FOUNDATIONS
Chapter 1 Defining Data Visualisation
Chapter 2 The Visualisation Design Process
PART B THE HIDDEN THINKING
Chapter 3 Formulating Your Brief
Chapter 4 Working With Data
Chapter 5 Establishing Your Editorial Thinking
PART C DESIGN THINKING
Chapter 6 Data Representation
Chapter 7 Interactivity
Chapter 8 Annotation
Chapter 9 Colour
Chapter 10 Composition
EPILOGUE
| Erscheinungsdatum | 13.09.2019 |
|---|---|
| Verlagsort | London |
| Sprache | englisch |
| Maße | 189 x 246 mm |
| Gewicht | 700 g |
| Themenwelt | Mathematik / Informatik ► Informatik ► Datenbanken |
| ISBN-10 | 1-5264-6892-1 / 1526468921 |
| ISBN-13 | 978-1-5264-6892-5 / 9781526468925 |
| Zustand | Neuware |
| Informationen gemäß Produktsicherheitsverordnung (GPSR) | |
| Haben Sie eine Frage zum Produkt? |
aus dem Bereich


