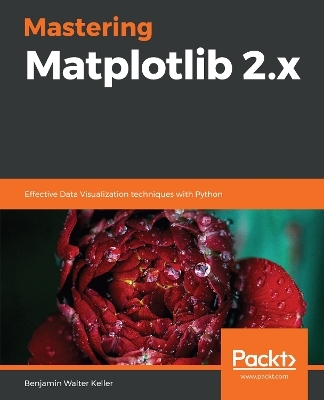
Mastering Matplotlib 2.x
Packt Publishing Limited (Verlag)
978-1-78961-769-6 (ISBN)
Understand and build beautiful and advanced plots with Matplotlib and Python
Key Features
Practical guide with hands-on examples to design interactive plots
Advanced techniques to constructing complex plots
Explore 3D plotting and visualization using Jupyter Notebook
Book DescriptionIn this book, you’ll get hands-on with customizing your data plots with the help of Matplotlib. You’ll start with customizing plots, making a handful of special-purpose plots, and building 3D plots. You’ll explore non-trivial layouts, Pylab customization, and more about tile configuration. You’ll be able to add text, put lines in plots, and also handle polygons, shapes, and annotations. Non-Cartesian and vector plots are exciting to construct, and you’ll explore them further in this book. You’ll delve into niche plots and visualize ordinal and tabular data. In this book, you’ll be exploring 3D plotting, one of the best features when it comes to 3D data visualization, along with Jupyter Notebook, widgets, and creating movies for enhanced data representation. Geospatial plotting will also be explored. Finally, you’ll learn how to create interactive plots with the help of Jupyter.
Learn expert techniques for effective data visualization using Matplotlib 3 and Python with our latest offering -- Matplotlib 3.0 Cookbook
What you will learn
Deal with non-trivial and unusual plots
Understanding Basemap methods
Customize and represent data in 3D
Construct Non-Cartesian and vector plots
Design interactive plots using Jupyter Notebook
Make movies for enhanced data representation
Who this book is forThis book is aimed at individuals who want to explore data visualization techniques. A basic knowledge of Matplotlib and Python is required.
Benjamin Walter Keller is currently a PhD candidate at McMaster University and gained his BSc in physics with a minor in computer science from the University of Calgary in 2011. His current research involves numerical modeling of galaxy evolution over cosmological timescales. As an undergraduate at the U of C, he worked on stacking radio polarization to examine faint extragalactic sources. He also worked in the POSSUM Working Group 2 to determine the requirements for stacking applications for the Australian SKA Pathfinder (ASKAP) radio telescope. He is particularly interested in questions involving stellar feedback (supernovae, stellar winds, and so on) and its impact on galaxies and their surrounding intergalactic medium.
Table of Contents
Heavy Customization
Drawing on Plots
Special Purpose Plots
3D & Geospatial Plotting
Interactive Plotting
| Erscheinungsdatum | 04.12.2018 |
|---|---|
| Verlagsort | Birmingham |
| Sprache | englisch |
| Maße | 75 x 93 mm |
| Themenwelt | Mathematik / Informatik ► Informatik ► Datenbanken |
| Mathematik / Informatik ► Informatik ► Programmiersprachen / -werkzeuge | |
| Informatik ► Software Entwicklung ► User Interfaces (HCI) | |
| ISBN-10 | 1-78961-769-3 / 1789617693 |
| ISBN-13 | 978-1-78961-769-6 / 9781789617696 |
| Zustand | Neuware |
| Haben Sie eine Frage zum Produkt? |
aus dem Bereich


