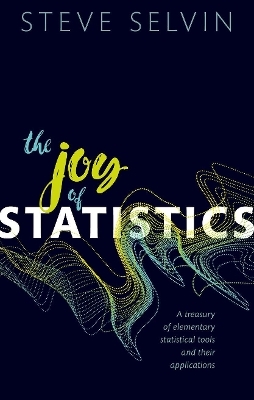
The Joy of Statistics
Oxford University Press (Verlag)
978-0-19-883344-4 (ISBN)
The vast majority of statistics books delineate techniques used to analyze collected data. The Joy of Statistics is not one of these books. It consists of a series of 42 "short stories", each illustrating how statistical methods applied to data produce insight and solutions to the questions the data were collected to answer. Real-life and sometimes artificial data are used to demonstrate the often painless method and magic of statistics. In addition, the text contains brief histories of the evolution of statistical methods and a number of brief biographies of the most famous statisticians of the 20th century. Sprinkled throughout are statistical jokes, puzzles and traditional stories. The levels of statistical texts span a spectrum, from elementary to introductory to application to theoretical to advanced mathematical.
This book explores a variety of statistical applications using graphs and plots, along with detailed and intuitive descriptions, and occasionally a bit of 10th grade mathematics. Examples of a few of the topics included among these "short stories" are pet ownership, gambling games such as roulette, blackjack and lotteries, as well as more serious subjects such as comparison of black/white infant mortality risk, infant birth weight and maternal age, estimation of coronary heart disease risk and racial differences in Hodgkin disease. The statistical descriptions of these topics are in many cases accompanied by easy to understand explanations labelled "How it Works."
Steve Selvin is a professor of biostatistics and epidemiology at the University of California, Berkeley. He has taught on the Berkeley campus for more than 40 years. Professor Selvin is also a member of the Johns Hopkins School of Public Health faculty and has taught in the Summer Institute of Biostatistics and Epidemiology for the last fifteen years. He lives in the Berkeley hills with two cats, one dog and a wife who is a well known ceramic artist. He has authored or co-authored more than 250 scientific papers in the area of statistics applied to epidemiological/health issues with emphasis on birth defects and childhood cancer. In addition he has written 10 books on applied statistical methods. He has received a number of awards for teaching excellence, including the most prestigious award given by the University of California called the Berkeley Citation. His present research concerns the analysis of spatial patterns of childhood cancers in the state of California over the last decade.
1: Probabilities -- rules and review
2: Distributions of data -- four plots
3: Mean value -- estimation and a few properties
4: Boxplots -- construction and interpretation
5: The lady who tasted tea -- a bit of statistical history
6: Outlier/extreme values -- a difficult decision
7: The role of summary statistics -- brief description
8: Correlation and association -- interpretation
9: Proportional reduction in error -- a measure of association
10: Quick Tests -- four examples
11: Confounding -- African-American and white infant mortality
12: Odds -- a sometimes measure of likelihood
13: Odds ratio -- a measure of risk?
14: Odds ratio -- two properties rarely mentioned
15: Percent increase -- ratios?
16: Diagnostic tests -- assessing accuracy
17: Regression to the mean -- father/son data
18: Life table -- a summary of mortality experience
19: Coincidence -- a statistical description
20: Draft lottery numbers (1970)
21: Lotto -- How to get in .... How to win
22: Fatal coronary disease -- risk
23: Pictures
24: The Monty Hall problem
25: Eye-witness evidence -- Collins versus state of California
26: Probabilities and puzzles
27: Jokes and quotes
28: A true life puzzle
29: Rates -- definition and estimation
30: Geometry of an approximate average rate
31: Simpson>'s paradox -- two examples and a bit more
32: Smoothing -- median values
33: Two by two table -- a missing observation
34: Survey data -- randomized response
35: Viral incidence estimation -- a shortcut
36: Two-way table -- a graphical analysis
37: Data -- too good to be true?
38: A binary variable -- twin pairs
39: Mr. Rich and Mr. Poor -- a give and take equilibrium
40: Log-normal distribution -- leukemia and pesticide exposure
41: Poem -- A Contribution to Statistics
APP: appendix: golden mean, Pythagorean theorem, chord theorem, pi
| Erscheinungsdatum | 29.06.2019 |
|---|---|
| Zusatzinfo | 105 line drawings |
| Verlagsort | Oxford |
| Sprache | englisch |
| Maße | 146 x 224 mm |
| Gewicht | 442 g |
| Themenwelt | Mathematik / Informatik ► Mathematik ► Angewandte Mathematik |
| Mathematik / Informatik ► Mathematik ► Mathematische Spiele und Unterhaltung | |
| Mathematik / Informatik ► Mathematik ► Statistik | |
| ISBN-10 | 0-19-883344-X / 019883344X |
| ISBN-13 | 978-0-19-883344-4 / 9780198833444 |
| Zustand | Neuware |
| Informationen gemäß Produktsicherheitsverordnung (GPSR) | |
| Haben Sie eine Frage zum Produkt? |
aus dem Bereich


