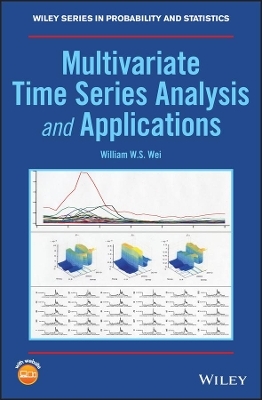
Multivariate Time Series Analysis and Applications
John Wiley & Sons Inc (Verlag)
978-1-119-50285-2 (ISBN)
Following the highly successful and much lauded book, Time Series Analysis—Univariate and Multivariate Methods, this new work by William W.S. Wei focuses on high dimensional multivariate time series, and is illustrated with numerous high dimensional empirical time series. Beginning with the fundamentalconcepts and issues of multivariate time series analysis,this book covers many topics that are not found in general multivariate time series books. Some of these are repeated measurements, space-time series modelling, and dimension reduction. The book also looks at vector time series models, multivariate time series regression models, and principle component analysis of multivariate time series. Additionally, it provides readers with information on factor analysis of multivariate time series, multivariate GARCH models, and multivariate spectral analysis of time series.
With the development of computers and the internet, we have increased potential for data exploration. In the next few years, dimension will become a more serious problem. Multivariate Time Series Analysis and its Applications provides some initial solutions, which may encourage the development of related software needed for the high dimensional multivariate time series analysis.
Written by bestselling author and leading expert in the field
Covers topics not yet explored in current multivariate books
Features classroom tested material
Written specifically for time series courses
Multivariate Time Series Analysis and its Applications is designed for an advanced time series analysis course. It is a must-have for anyone studying time series analysis and is also relevant for students in economics, biostatistics, and engineering.
William W.S. Wei, PhD, is a Professor of Statistics at Temple University in Philadelphia, Pennsylvania, USA. He has been a Visiting Professor at many universities including Nankai University in China, National University of Colombia in Colombia, Korea University in Korea, National Chiao Tung University, National Sun Yat-Sen University, and National Taiwan University in Taiwan, and Middle East Technical University in Turkey. His research interests include time series analysis, forecasting methods, high dimensional problems, statistical modeling, and their applications.
About the author xiii
Preface xv
About the Companion website xvii
1 Fundamental Concepts and Issues in Multivariate Time Series Analysis 1
1.1 Introduction 1
1.2 Fundamental concepts 3
1.2.1 Correlation and partial correlation matrix functions 3
1.2.2 Vector white noise process 7
1.2.3 Moving average and autoregressive representations of vector processes 7
Projects 9
References 9
2 Vector Time Series Models 11
2.1 Vector moving average processes 11
2.2 Vector autoregressive processes 14
2.2.1 Granger causality 18
2.3 Vector autoregressive moving average processes 18
2.4 Nonstationary vector autoregressive moving average processes 21
2.5 Vector time series model building 21
2.5.1 Identification of vector time series models 21
2.5.2 Sample moments of a vector time series 22
2.5.2.1 Sample mean and sample covariance matrices 22
2.5.2.2 Sample correlation matrix function 23
2.5.2.3 Sample partial correlation matrix function and extended cross-correlation matrices 24
2.5.3 Parameter estimation, diagnostic checking, and forecasting 24
2.5.4 Cointegration in vector time series 25
2.6 Seasonal vector time series model 26
2.7 Multivariate time series outliers 27
2.7.1 Types of multivariate time series outliers and detections 27
2.7.2 Outlier detection through projection pursuit 29
2.8 Empirical examples 32
2.8.1 First model of US monthly retail sales revenue 32
2.8.2 Second model of US monthly retail sales revenue 43
2.8.3 US macroeconomic indicators 47
2.8.4 Unemployment rates with outliers 58
Software code 65
Projects 100
References 101
3 Multivariate Time Series Regression Models 105
3.1 Introduction 105
3.2 Multivariate multiple time series regression models 105
3.2.1 The classical multiple regression model 105
3.2.2 Multivariate multiple regression model 106
3.3 Estimation of the multivariate multiple time series regression model 108
3.3.1 The Generalized Least Squares (GLS) estimation 108
3.3.2 Empirical Example I – U.S. retail sales and some national indicators 109
3.4 Vector time series regression models 114
3.4.1 Extension of a VAR model to VARX models 114
3.4.2 Empirical Example II – VARX models for U.S. retail sales and some national indicators 115
3.5 Empirical Example III – Total mortality and air pollution in California 120
Software code 129
Projects 137
References 137
4 Principle Component Analysis of Multivariate Time Series 139
4.1 Introduction 139
4.2 Population PCA 140
4.3 Implications of PCA 141
4.4 Sample principle components 142
4.5 Empirical examples 145
4.5.1 Daily stock returns from the first set of 10 stocks 145
4.5.1.1 The PCA based on the sample covariance matrix 147
4.5.1.2 The PCA based on the sample correlation matrix 150
4.5.2 Monthly Consumer Price Index (CPI) from five sectors 152
4.5.2.1 The PCA based on the sample covariance matrix 153
4.5.2.2 The PCA based on the sample correlation matrix 154
Software code 157
Projects 160
References 161
5 Factor Analysis of Multivariate Time Series 163
5.1 Introduction 163
5.2 The orthogonal factor model 163
5.3 Estimation of the factor model 165
5.3.1 The principal component method 165
5.3.2 Empirical Example I – Model 1 on daily stock returns from the second set of 10 stocks 166
5.3.3 The maximum likelihood method 169
5.3.4 Empirical Example II – Model 2 on daily stock returns from the second set of 10 stocks 173
5.4 Factor rotation 175
5.4.1 Orthogonal rotation 176
5.4.2 Oblique rotation 176
5.4.3 Empirical Example III – Model 3 on daily stock returns from the second set of 10 stocks 177
5.5 Factor scores 178
5.5.1 Introduction 178
5.5.2 Empirical Example IV – Model 4 on daily stock returns from the second set of 10 stocks 179
5.6 Factor models with observable factors 181
5.7 Another empirical example – Yearly U.S. sexually transmitted diseases (STD) 183
5.7.1 Principal components analysis (PCA) 183
5.7.1.1 PCA for standardized Zt 183
5.7.1.2 PCA for unstandardized Zt 186
5.7.2 Factor analysis 186
5.8 Concluding remarks 193
Software code 194
Projects 200
References 201
6 Multivariate GARCH Models 203
6.1 Introduction 203
6.2 Representations of multivariate GARCH models 204
6.2.1 VEC and DVEC models 204
6.2.2 Constant Conditional Correlation (CCC) models 206
6.2.3 BEKK models 207
6.2.4 Factor models 208
6.3 O-GARCH and GO-GARCH models 209
6.4 Estimation of GO-GARCH models 210
6.4.1 The two-step estimation method 210
6.4.2 The weighted scatter estimation method 211
6.5 Properties of the weighted scatter estimator 213
6.5.1 Asymptotic distribution and statistical inference 213
6.5.2 Combining information from different weighting functions 214
6.6 Empirical examples 215
6.6.1 U.S. weekly interest over time on six exercise items 215
6.6.1.1 Choose a best VAR/VARMA model 216
6.6.1.2 Finding a VARMA-ARCH/GARCH model 218
6.6.1.3 The fitted values from VAR(1)-ARCH(1) model 221
6.6.2 Daily log-returns of the SP 500 index and three financial stocks 222
6.6.3 The analysis of the Dow Jones Industrial Average of 30 stocks 225
Software code 229
Projects 234
References 234
7 Repeated Measurements 237
7.1 Introduction 237
7.2 Multivariate analysis of variance 239
7.2.1 Test treatment effects 239
7.2.2 Empirical Example I – First analysis on body weight of rats under three different treatments 241
7.3 Models utilizing time series structure 243
7.3.1 Fixed effects model 243
7.3.2 Some common variance–covariance structures 247
7.3.3 Empirical Example II – Further analysis on body weight of rats under three different treatments 250
7.3.4 Random effects and mixed effects models 252
7.4 Nested random effects model 253
7.5 Further generalization and remarks 254
7.6 Another empirical example – the oral condition of neck cancer patients 255
Software code 257
Projects 258
References 258
8 Space–Time Series Models 261
8.1 Introduction 261
8.2 Space–time autoregressive integrated moving average (STARIMA) models 262
8.2.1 Spatial weighting matrix 262
8.2.2 STARIMA models 265
8.2.3 STARMA models 266
8.2.4 ST-ACF and ST-PACF 267
8.3 Generalized space–time autoregressive integrated moving average (GSTARIMA) models 272
8.4 Iterative model building of STARMA and GSTARMA models 273
8.5 Empirical examples 273
8.5.1 Vehicular theft data 273
8.5.2 The annual U.S. labor force count 279
8.5.3 U.S. yearly sexually transmitted disease data 281
Software code 289
Projects 298
References 298
9 Multivariate Spectral Analysis of Time Series 301
9.1 Introduction 301
9.2 Spectral representations of multivariate time series processes 304
9.3 The estimation of the spectral density matrix 309
9.3.1 The smoothed spectrum matrix 309
9.3.2 Multitaper smoothing 313
9.3.3 Smoothing spline 315
9.3.4 Bayesian method 316
9.3.5 Penalized Whittle likelihood 317
9.3.6 VARMA spectral estimation 318
9.4 Empirical examples of stationary vector time series 320
9.4.1 Sample spectrum 320
9.4.2 Bayesian method 325
9.4.3 Penalized Whittle likelihood method 327
9.4.4 Example of VAR spectrum estimation 327
9.5 Spectrum analysis of a nonstationary vector time series 329
9.5.1 Introduction 329
9.5.2 Spectrum representations of a nonstationary multivariate process 331
9.5.2.1 Time-varying autoregressive model 332
9.5.2.2 Smoothing spline ANOVA model 333
9.5.2.3 Piecewise vector autoregressive model 334
9.5.2.4 Bayesian methods 336
9.6 Empirical spectrum example of nonstationary vector time series 337
Software code 341
Projects 434
References 435
10 Dimension Reduction in High-Dimensional Multivariate Time Series Analysis 437
10.1 Introduction 437
10.2 Existing methods 438
10.2.1 Regularization methods 439
10.2.1.1 The lasso method 439
10.2.1.2 The lag-weighted lasso method 440
10.2.1.3 The hierarchical vector autoregression (HVAR) method 440
10.2.2 The space–time AR (STAR) model 442
10.2.3 The model-based cluster method 443
10.2.4 The factor analysis 443
10.3 The proposed method for high-dimension reduction 444
10.4 Simulation studies 446
10.4.1 Scenario 1 446
10.4.2 Scenario 2 449
10.4.3 Scenario 3 449
10.5 Empirical examples 452
10.5.1 The macroeconomic time series 452
10.5.2 The yearly U.S. STD data 457
10.6 Further discussions and remarks 459
10.6.1 More on clustering 459
10.6.2 Forming aggregate data through both time domain and frequency domain clustering 461
10.6.2.1 Example of time domain clustering 461
10.6.2.2 Example of frequency domain clustering 461
10.6.2.2.1 Clustering using similarity measures 463
10.6.2.2.2 Clustering by subjective observation 463
10.6.2.2.3 Hierarchical clustering 463
10.6.2.2.4 Nonhierarchical clustering using the K-means method 463
10.6.3 The specification of aggregate matrix and its associated aggregate dimension 466
10.6.4 Be aware of other forms of aggregation 466
10.A Appendix: Parameter Estimation Results of Various Procedures 467
10.A.1 Further details of the macroeconomic time series 467
10.A.1.1 VAR(1) 467
10.A.1.2 Lasso 468
10.A.1.3 Componentwise 470
10.A.1.4 Own-other 471
10.A.1.5 Elementwise 473
10.A.1.6 The factor model 475
10.A.1.7 The model-based cluster 475
10.A.1.8 The proposed method 477
10.A.2 Further details of the STD time series 478
10.A.2.1 VAR 478
10.A.2.2 Lasso 478
10.A.2.3 Componentwise 479
10.A.2.4 Own-other 481
10.A.2.5 Elementwise 482
10.A.2.6 The STAR model 484
10.A.2.7 The factor model 486
10.A.2.8 The model-based cluster 487
10.A.2.9 The proposed method 488
Software code 490
Projects 505
References 506
Author index 509
Subject index 515
| Erscheinungsdatum | 18.03.2019 |
|---|---|
| Reihe/Serie | Wiley Series in Probability and Statistics |
| Verlagsort | New York |
| Sprache | englisch |
| Maße | 172 x 246 mm |
| Gewicht | 930 g |
| Themenwelt | Mathematik / Informatik ► Mathematik ► Analysis |
| ISBN-10 | 1-119-50285-3 / 1119502853 |
| ISBN-13 | 978-1-119-50285-2 / 9781119502852 |
| Zustand | Neuware |
| Informationen gemäß Produktsicherheitsverordnung (GPSR) | |
| Haben Sie eine Frage zum Produkt? |
aus dem Bereich


