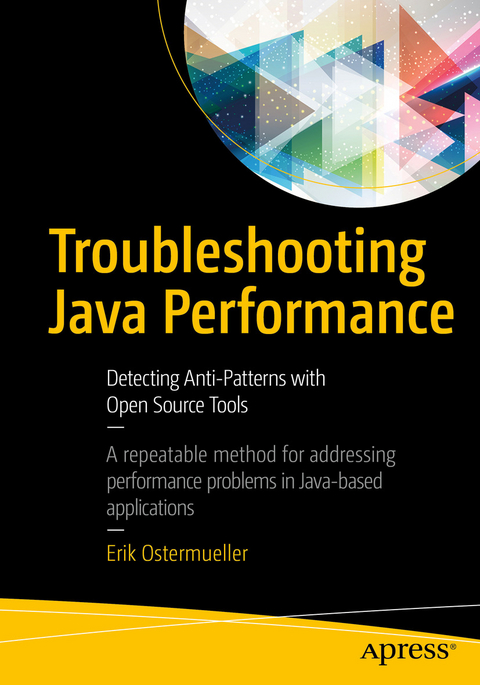
Troubleshooting Java Performance (eBook)
XXVI, 194 Seiten
Apress (Verlag)
978-1-4842-2979-8 (ISBN)
- Assess the performance health of four main problems areas in a Java system: The P.A.t.h. Checklist presents each area with its own set of plug-it-in-now tools
- Pinpoint the code at fault for CPU and other bottlenecks without a Java profiler
- Find memory leaks in just minutes using heapSpank, the author's open-source leak detector utility that is freely available from heapSpank.org
- Avoid the 6 most common ways to mess up a load test
- Determine the exact number of threads to dial into the load generator to test your system's scalability
- Detect the three most common SQL performance anti-patterns
- Measure network response times of calls to back-end systems ('alien systems')
- Identify whether garbage collection performance is healthy or unhealthy and whether delays are caused by problems in the old or new generation, so you know which generation needs to be adjusted
Erik Ostermueller is a Java architect who is passionate about performance engineering. He has spent the last 10 years leading international performance engineering teams, tuning high-throughput Java financial systems in North and South America, Europe and Asia. In 2011, he presented a paper entitled 'How to Help Developers (Finally) Find Their Own Performance Defects' at the Computer Measurement Group's annual conference, where he won 'Best Paper' and the 'Mullen Award' for best speaker. The proceeds of this award financed an eight-city speaking tour in the US, Canada, the UK, and Italy.
Erik is the technical lead for the Performance Center of Excellence at FIS Global. He is the founder of heapSpank.org, wuqiSpank.org, and a contributor to JMeter-Plugins.org and other open source projects. He lives in Little Rock, Arkansas and plays soccer, tennis, and the piano.Troubleshoot the most widespread and pernicious Java performance problems using a set of open-source and freely-available tools that will make you dramatically more productive in finding the root causes of slow performance. This is a brief book that focuses on a small number of performance anti-patterns, and you'll find that most problems you encounter fit into one of these anti-patterns. The book provides a specific method in a series of steps referred to as the "e;P.A.t.h. Checklist"e; that encompasses persistence, alien systems, threads, and heap management. These steps guide you through a troubleshooting process that is repeatable, that you can apply to any performance problem in a Java application. This technique is especially helpful in 'dark' environments with little monitoring.Performance problems are not always localized to Java, but often fall into the realms of database access and server load. This book gives attention to both of these issues through examples showing how to identify repetitive SQL, and identify architecture-wide performance problems ahead of production rollout. Learn how to apply load like an expert, and determine how much load to apply to determine whether your system scales. Included are walk-throughs of a dozen server-side performance puzzles that are ready to run on your own machine. Following these examples helps you learn to:Assess the performance health of four main problems areas in a Java system: The P.A.t.h. Checklist presents each area with its own set of plug-it-in-now toolsPinpoint the code at fault for CPU and other bottlenecks without a Java profilerFind memory leaks in just minutes using heapSpank, the author's open-source leak detector utility that is freely available from heapSpank.orgThe repeatable method provided in this book is an antidote to lackluster average response times that are multi-second throughout the industry. This book provides a long absent, easy-to-follow, performance training regimen that will benefit anyone programming in Java. What You'll LearnAvoid the 6 most common ways to mess up a load testDetermine the exact number of threads to dial into the load generator to test your system's scalabilityDetect the three most common SQL performance anti-patternsMeasure network response times of calls to back-end systems ('alien systems')Identify whether garbage collection performance is healthy or unhealthy and whether delays are caused by problems in the old or new generation, so you know which generation needs to be adjustedWho This Book Is ForIntermediate and expert Java developers and architects. Java experts will be able to update their skill set with the latest and most productive, open-source Java performance tools. IntermediateJava developers are exposed to the most common performance defects that repeatedly show up in Java applications, ones that account for the bulk of slow-performing systems. Experts and intermediates alike will benefit from the chapters on load generation.
Erik Ostermueller is a Java architect who is passionate about performance engineering. He has spent the last 10 years leading international performance engineering teams, tuning high-throughput Java financial systems in North and South America, Europe and Asia. In 2011, he presented a paper entitled “How to Help Developers (Finally) Find Their Own Performance Defects” at the Computer Measurement Group’s annual conference, where he won “Best Paper” and the “Mullen Award” for best speaker. The proceeds of this award financed an eight-city speaking tour in the US, Canada, the UK, and Italy. Erik is the technical lead for the Performance Center of Excellence at FIS Global. He is the founder of heapSpank.org, wuqiSpank.org, and a contributor to JMeter-Plugins.org and other open source projects. He lives in Little Rock, Arkansas and plays soccer, tennis, and the piano.
Contents at a Glance 5
Contents 7
About the Author 14
About the Technical Reviewer 15
Acknowledgments 16
Introduction 17
Part I: Getting Started with Performance Tuning 23
Chapter 1: Performance Anti-Patterns 24
Main Performance Anti-Patterns 24
Main Anti-Pattern #1: Unnecessary Initialization 25
Main Anti-Pattern #2: Strategy/Algorithm Inefficiency 26
Main Anti-Pattern #3: Overprocessing 27
Main Anti-Pattern #4: Large Processing Challenge 28
Assessing the Size of a Processing Challenge 28
Using the Main Performance Anti-Patterns 29
Don’t Forget 30
What’s Next 30
Chapter 2: A Modest-sized Tuning Environment 31
Rapid Tuning 31
Write-Once-Run-Anywhere Performance Defects 32
Tuning Environment for Developers 33
Network 35
Stubbing Out Back-end Systems 36
Stubbing Out HTTP Back-ends with Wiremock 37
Local Load Generation 39
Quick Overview of Load Generation 39
Load Generator Responsibilities 39
CPU Consumption by PID 40
Comparison Metrics 42
Don’t Forget 43
What’s Next 43
Chapter 3: Metrics: The Antidote to Guesswork 44
Which Metric? 44
Setting Direction for Tuning 45
The Backup Plan: Indirect Performance Assessment with Load Generator Metrics 46
Large Payloads are a Red Flag 46
Variability Is a Red Flag 47
Creatively Setting Direction for Tuning 48
Creative Test Plan 1 48
Creative Test Plan 2 49
Tracking Performance Progress 49
Don’t Forget 51
What’s Next 51
Part II: Creating Load Scripts and Load Testing 52
Chapter 4: Load Generation Overview 53
The Load Generator 54
Correlation Variables 54
Sequencing Steps in a Load Script 55
The First Priority Script 56
Load Scripts and SUT Logons 56
Using the Same SUT User in Multiple Threads 57
Second Priority 58
Load Script Stage 1 58
Details 58
Validating HTTP Responses 58
Load Script Stage 2 58
Details 59
Load Script Stage 3 59
Details 59
Load Script Stage 4 61
Invite Skepticism 61
Project Lifecycle Hints 62
Don’t Forget 62
What’s Next 63
Chapter 5: Invalid Load Tests 64
Network Issues 64
Container Issues 65
Insufficient Warmup 68
Maxed-Out Hardware Resources 68
Virtualization Issues 68
Wrong Workload Issues 70
Load Script Errors 71
Don’t Forget 72
What’s Next 73
Chapter 6: A Scalability Yardstick 74
Creating a Scalability Yardstick Load Plan 74
Interpreting Results 77
Imperfect and Essential 80
Reproducing Bad Performance 80
Good and Bad CPU Consumption 81
Don’t Forget 82
What’s Next 83
Chapter 7: JMeter Must-Know Features 84
Love Letter to JMeter 85
Using jmeter-plugins.org Is a Must 87
PerfMon 88
JMeter user.properties Is Your Friend 90
JMeter Introduction 91
UI Features for Working Quickly 93
Functional Validation During Load Test Using JMeter Assertions 94
Script Variables 97
Saving Performance Results to Disk 98
How to Avoid Redundant Copies of Huge Files 100
Right-Sizing Output Files for Heavy Debugging or High Throughput 101
Recording an HTTP Script 103
Debugging an HTTP Recording 106
Load Testing Java Directly and Debugging 107
JMeter Sandbox 108
JMeter Sandbox with One Graph 110
JMeter Sandbox / Multiple Metrics on Same Graph 110
JMeter Sandbox for Testing Correlation Variables 113
Fishing Expedition—Step One, Find the Data Item 114
Fishing Expedition—Step Two 116
Prerequisites 118
Don’t Forget 120
What’s Next 120
Part III: The P.A.t.h. Checklist and Performance Troubleshooting 121
Chapter 8: Introduction to the P.A.t.h. Checklist 122
Quick Review 122
Working the P.A.t.h. Checklist 124
Running the Examples 126
Java Performance Troubleshooting (jpt) Sample App 126
littleMock Sample Application 128
Don’t Forget 129
What’s Next 130
Chapter 9: Persistence, the “P” in P.A.t.h. 131
Test 05: Performance Issues with One SQL 131
Performance Issues with Multiple SQL Statements 133
The First Issue: SELECT N+1 134
Five Variations of SELECT N+1 Load Tests 135
Chunky Outperforms Chatty 138
Chunky Doesn’t Always Perform Well 138
Detecting SELECT N+1 139
The Second Issue: Uncached SELECTS to Static Data 140
JPA and Hibernate 142
Don’t Forget 143
What’s Next 143
Chapter 10: Alien Systems, the “A” in P.A.t.h. 144
Lowering Response Time over Long Distances 144
Compression Makes Things Go Faster 144
Security Warning for Compression with HTTPS 147
Message Size 147
Using Thread Dumps to Detect Network Requests 148
Quantifying Response Time 149
Identifying Clear Text Payloads That Could Benefit from Compression 150
Don’t Forget 151
What’s Next 152
Chapter 11: Threads, the “t” in P.A.t.h. 153
Current use of Thread Dumps 153
Threads and Thread Dumps 154
Navigating Thread Dumps 155
Key Landmarks in a Stack Trace 155
Thread Names are Helpful 157
Focus on the Threads under Load 157
Manual Thread Dump Profiling (MTDP) 158
Example 1 159
Sample Size and Healthy Skepticism 161
MTDP Demonstration 162
Navigating Unfamiliar Code 164
Leveraging the Four Anti-Patterns 165
Interactive Thread Dump Reading Exercise 165
How to Make Code Faster 167
Limitations 168
How Much Load? 169
Distinguishing High Throughput and Slow Stack Traces 169
MTDP and Other Examples 169
Don’t Forget 171
What’s Next 171
Chapter 12: Heap, the “h” in P.A.t.h. 172
Quick GC Health Check 172
The Traditional Approach to GC Metrics 173
Garbage Collector Overview 174
Plug-It-in-Now GC Metrics with jstat 175
Configuring littleMock Performance with Test Keys 176
Optimizing Young Gen GC 176
Optimizing Old Gen GC 177
Heap Trending 180
Using JVM Parameters to Size the Heap 181
Caution Using NewRatio 183
Blindly Increasing -Xmx 184
Reclaiming Unused RAM 184
Memory Leaks 186
Troubleshooting Memory Leaks 186
Heap Dump Analysis 188
Capturing a Heap Dump 188
Using Eclipse MAT to Find Memory Leaks 189
Eclipse MAT Automatic Leak Detection 189
Exploring in Eclipse MAT 191
Kinds of Leaks 194
Heap Troubleshooting, Step-by-Step 195
Don’t Forget 196
Chapter 13: Conclusion 198
Steps for Getting Started 198
Using this Book with Large Monitoring Tools 199
3t0tt (3 Threads of Load, Zero Think Time) 200
One Last Word 200
Index 201
| Erscheint lt. Verlag | 30.9.2017 |
|---|---|
| Zusatzinfo | XXVI, 194 p. 93 illus., 87 illus. in color. |
| Verlagsort | Berkeley |
| Sprache | englisch |
| Themenwelt | Informatik ► Programmiersprachen / -werkzeuge ► Java |
| Mathematik / Informatik ► Informatik ► Web / Internet | |
| Schlagworte | Database Performance • Garbage Collection • Glowroot • heapSpank • jmap • jmeter • jstack • Load Testing • Network Performance • Response time • Server load • Server-side performance • SQL performance |
| ISBN-10 | 1-4842-2979-7 / 1484229797 |
| ISBN-13 | 978-1-4842-2979-8 / 9781484229798 |
| Informationen gemäß Produktsicherheitsverordnung (GPSR) | |
| Haben Sie eine Frage zum Produkt? |
Größe: 7,7 MB
DRM: Digitales Wasserzeichen
Dieses eBook enthält ein digitales Wasserzeichen und ist damit für Sie personalisiert. Bei einer missbräuchlichen Weitergabe des eBooks an Dritte ist eine Rückverfolgung an die Quelle möglich.
Dateiformat: PDF (Portable Document Format)
Mit einem festen Seitenlayout eignet sich die PDF besonders für Fachbücher mit Spalten, Tabellen und Abbildungen. Eine PDF kann auf fast allen Geräten angezeigt werden, ist aber für kleine Displays (Smartphone, eReader) nur eingeschränkt geeignet.
Systemvoraussetzungen:
PC/Mac: Mit einem PC oder Mac können Sie dieses eBook lesen. Sie benötigen dafür einen PDF-Viewer - z.B. den Adobe Reader oder Adobe Digital Editions.
eReader: Dieses eBook kann mit (fast) allen eBook-Readern gelesen werden. Mit dem amazon-Kindle ist es aber nicht kompatibel.
Smartphone/Tablet: Egal ob Apple oder Android, dieses eBook können Sie lesen. Sie benötigen dafür einen PDF-Viewer - z.B. die kostenlose Adobe Digital Editions-App.
Zusätzliches Feature: Online Lesen
Dieses eBook können Sie zusätzlich zum Download auch online im Webbrowser lesen.
Buying eBooks from abroad
For tax law reasons we can sell eBooks just within Germany and Switzerland. Regrettably we cannot fulfill eBook-orders from other countries.
aus dem Bereich


