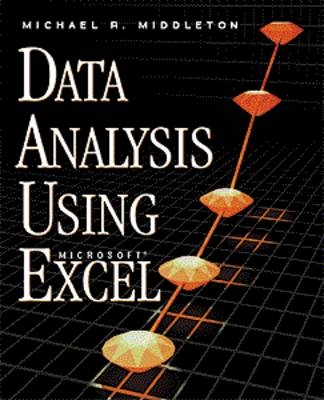
Data Analysis Using Microsoft Excel
Brooks/Cole (Verlag)
978-0-534-35968-3 (ISBN)
- Titel erscheint in neuer Auflage
- Artikel merken
QUICK GUIDE TO STATISTICAL TECHNIQUES. 1. INTRODUCTION TO EXCEL. Mouse and Menu Conventions. Windows 95 Start Button. Windows 95 Help. Copying Files. Starting Excel. Excel Help. Exercises. 2. MANAGING FILES AND PRINTING. Workbooks, Sheets, and Charts. Opening Text Files. Backups and Version Control. Page Setup, Previews, and Printing. Exercises. 3. BASIC CHARTS. Bar and Column Charts. Pie Charts. Line Charts for Time Sequence Data. Embedded Charts and Chart Sheets. Chart UpDown VBA macros (Optional). Exercises. 4. UNIVARIATE NUMERICAL DATA. Analysis Tool: Descriptive Statistics. Analysis Tool: Histogram. Analysis Tool: Ranks and Percentile. Exercises. 5. CATEGORICAL DATA. Single-Variable Tally. Two-Way Table. Exercises. 6. BIVARIATE NUMBERICAL DATA. XY (Scatter) Charts. Analysis Tool: Correlation. Analysis Tool: Covariance. Correlations for Several Variables. Exercises. 7. PROBABILITY DISTRIBUTIONS. Binomial Distribution. Other Discrete Distributions. Normal Distribution. t and Other Continuous Distributions. Exercises. 8. SAMPLING AND SIMULATION. Analysis Tool: Sampling. Analysis Tool: Random Number Generation. Random Numbers Using the RAND Function. Simulating the Central Limit Effect. Simulating a Random Walk. Exercises. 9. ONE-SAMPLE INFERENCE FOR THE MEAN. Normal Versus t Distribution. Confidence Interval Using Normal. Confidence Interval Using t. Hypothesis Tests. Hypothesis Tests Using Normal. Hypothesis Tests Using t. Exercises. 10. QUALITY CONTROL CHARTS. Mean Charts. Standard Deviation Charts. Exercises. 11. TWO-SAMPLE INFERENCE FOR MEANS. Equal Variances Using t. Unequal Variances Using t. Paired Samples Using t. Exercises. 12. CHI-SQUARE TESTS. Chi-Square Test for Normality. Contingency Table p-Value. Chi-Square Statistic. Exercises. 13. ANALYSIS OF VARIANCE. Single-Factor ANOVA. Two-Factor ANOVA Without Replication. Two-Factor ANOVA with Replication. Two-Sample F-Test of Variances. Exercises. 14. SIMPLE LINEAR REGRESSION. Inserting a Linear Trendline. Regression Analysis Tool. Regression Functions. Exercises. 15. SIMPLE NONLINEAR REGRESSION. Polynomial. Logarithmic. Power. Exponential. Exercises. 16. MULTIPLE REGRESSION. Interpretation of Regression Output. Analysis of Residuals. using TREND to Make Predictions. Exercises. 17. REGRESSION USING CATEGORICAL VARIABLES. Categories as Explanatory Variables. Interpretation of Regression Using Indicators. Interpretation of Multiple Regression. Categories as the Dependent Variable. Exercises. 18. AUTOCORRELATION AND AUTOREGRESSION. Linear Time Trend. Durbin-Watson Statistic. Autocorrelation. Autoregression. Autocorrelation Coefficients Function. AR(2) Model. Exercises. 19. TIME SERIES SMOOTHING. Moving Average Using Insert Trendline. Moving Average Using Data Analysis Tool. Exponential Smoothing Tool. Initial Value for Exponential Smoothing. Optimal Smoothing Constant. Exercises. 20. TIME SERIES SEASONALITY. Regression Using Indicator Variables. AR(4) Model.
| Erscheint lt. Verlag | 20.8.1999 |
|---|---|
| Verlagsort | CA |
| Sprache | englisch |
| Maße | 184 x 241 mm |
| Gewicht | 476 g |
| Themenwelt | Mathematik / Informatik ► Informatik ► Datenbanken |
| Informatik ► Office Programme ► Excel | |
| Mathematik / Informatik ► Mathematik ► Computerprogramme / Computeralgebra | |
| ISBN-10 | 0-534-35968-X / 053435968X |
| ISBN-13 | 978-0-534-35968-3 / 9780534359683 |
| Zustand | Neuware |
| Informationen gemäß Produktsicherheitsverordnung (GPSR) | |
| Haben Sie eine Frage zum Produkt? |
aus dem Bereich


