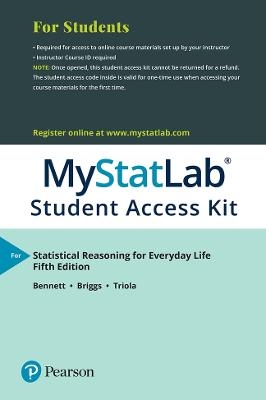
MyLab Statistics with Pearson eText Access Code (24 Months) for Statistical Reasoning for Everyday Life
Pearson (Hersteller)
978-0-13-467852-8 (ISBN)
- Titel z.Zt. nicht lieferbar
- Versandkostenfrei innerhalb Deutschlands
- Auch auf Rechnung
- Verfügbarkeit in der Filiale vor Ort prüfen
- Artikel merken
Used books, rentals, and purchases made outside of Pearson
If purchasing or renting from companies other than Pearson, the access codes for Pearson's MyLab products may not be included, may be incorrect, or may be previously redeemed. Check with the seller before completing your purchase.
For courses in Statistical Literacy
This package includes MyLab Statistics.
A qualitative approach teaches students how to reason using statistics
Understanding the core ideas behind statistics is crucial to everyday success in the modern world. Statistical Reasoning for Everyday Life is designed to teach these core ideas through real-life examples so that students are able to understand the statistics needed in their college courses, reason with statistical information in their careers, and to evaluate and make everyday decisions using statistics. The authors approach each concept qualitatively, using computation techniques only to enhance understanding and build on ideas step-by-step, working up to real examples and complex case studies. The Fifth Edition has been revised to update many exercises, examples, and case studies to engage today’s students with the latest data and relevant topics.
Personalize learning with MyLab Statistics
MyLab™ Statistics is an online homework, tutorial, and assessment program designed to work with this text to engage students and improve results. Within its structured environment, students practice what they learn, test their understanding, and pursue a personalized study plan that helps them absorb course material and understand difficult concepts.
NOTE: This package includes a MyLab Statistics access kit created specifically for Bennett/Briggs/Triola, Statistical Reasoning for Everyday Life 5/e. This title-specific access kit provides access to the Bennett/Briggs/Triola, Statistical Reasoning for Everyday Life 5/e accompanying MyLab course ONLY.
0134701364 / 9780134701363 Statistical Reasoning for Everyday Life Plus NEW MyLab Statistics with Pearson eText -- Access Card Package, 5/e
Package consists of:
0134494040 / 9780134494043 Statistical Reasoning for Everyday Life
0134678524 / 9780134678528 MyLab Statistics with Pearson eText -- Standalone Access Card -- for Statistical Reasoning for Everyday Life
0134678559 / 9780134678559 MyLab Statistics -- Royalty Bearing Content -- for Statistical Reasoning for Everyday Life
Preface
Supplements
How to Succeed in Your Statistics Course
Applications Index
1. Speaking of Statistics
1.1 What Is/Are Statistics?
1.2 Sampling
1.3 Types of Statistical Studies
1.4 Should You Believe a Statistical Study?
FOCUS ON PSYCHOLOGY: Are You Driving “Drunk” on Your Cell Phone?
FOCUS ON PUBLIC HEALTH: Is Your Lifestyle Healthy?
2. Measurement in Statistics
2.1 Data Types and Levels of Measurement
2.2 Dealing with Errors
2.3 Uses of Percentages in Statistics
2.4 Index Numbers
USING TECHNOLOGY: Inflation Calculator
FOCUS ON POLITICS: Who Benefited Most from Lower Tax Rates?
FOCUS ON ECONOMICS: Can a Redefined CPI Help the National Debt?
3. Visual Displays of Data
3.1 Frequency Tables
USING TECHNOLOGY: Frequency Tables
3.2 Picturing Distributions of Data
USING TECHNOLOGY: Bar Graphs
USING TECHNOLOGY: Pie Charts
USING TECHNOLOGY: Line Charts and Histograms
3.3 Graphics in the Media
USING TECHNOLOGY: Graphs with Multiple Data Sets
3.4 A Few Cautions about Graphics
FOCUS ON HISTORY: Can War Be Described with a Graph?
FOCUS ON THE ENVIRONMENT: Are We Changing Earth’s Atmosphere?
4. Describing Data
4.1 What Is Average?
USING TECHNOLOGY: Mean, Median, and Mode
4.2 Shapes of Distributions
4.3 Measures of Variation
USING TECHNOLOGY: Quartiles
USING TECHNOLOGY: Boxplots
USING TECHNOLOGY: Standard Deviation
4.4 Statistical Paradoxes
FOCUS ON THE STOCK MARKET: What’s Average about the Dow?
FOCUS ON ECONOMICS: Are the Rich Getting Richer?
5. A Normal World
5.1 What Is Normal?
5.2 Properties of the Normal Distribution
USING TECHNOLOGY: Standard Scores and Percentiles
5.3 The Central Limit Theorem
FOCUS ON EDUCATION: What Can We Learn from SAT Trends?
FOCUS ON PSYCHOLOGY: Are We Smarter Than Our Parents?
6. Probability in Statistics
6.1 The Role of Probability in Statistics: Statistical Significance
6.2 Basics of Probability
6.3 The Law of Large Numbers
6.4 Ideas of Risk and Life Expectancy
6.5 Combining Probabilities (Supplementary Section)
FOCUS ON SOCIAL SCIENCE: Do Lotteries Harm the Poor?
FOCUS ON LAW: Is DNA Analysis Reliable?
7. Correlation and Causality
7.1 Seeking Correlation
USING TECHNOLOGY: Scatterplots and Correlation Coefficients
7.2 Interpreting Correlations
7.3 Best-Fit Lines and Prediction
7.4 The Search for Causality
FOCUS ON EDUCATION: What Helps Children Learn to Read?
FOCUS ON THE ENVIRONMENT: What Is Causing Global Warming?
8. Inferences from Samples to Populations
8.1 Sampling Distributions
8.2 Estimating Population Means
USING TECHNOLOGY: Confidence Interval for a Population Mean
8.3 Estimating Population Proportions
USING TECHNOLOGY: Confidence Interval for a Population Proportion
FOCUS ON HISTORY: Where Did Statistics Begin?
FOCUS ON LITERATURE: How Many Words Did Shakespeare Know?
9. Hypothesis Testing
9.1 Fundamentals of Hypothesis Testing
9.2 Hypothesis Tests for Population Means
USING TECHNOLOGY: Hypothesis Test for a Population Mean
9.3 Hypothesis Tests for Population Proportions
USING TECHNOLOGY: Hypothesis Test for a Population Proportion
FOCUS ON HEALTH AND EDUCATION: Will Your Education Help You Live Longer?
FOCUS ON AGRICULTURE: Are Genetically Modified Foods Safe?
10. t Tests, Two-Way Tables, and ANOVA
10.1 t Distribution for Inferences about a Mean
USING TECHNOLOGY: Confidence Intervals Using the t Distribution
USING TECHNOLOGY: Hypothesis Tests with the t Distribution
10.2 Hypothesis Testing with Two-Way Tables
USING TECHNOLOGY: Hypothesis Testing with Two-Way Tables
10.3 Analysis of Variance (One-Way ANOVA)
USING TECHNOLOGY: Analysis of Variance
FOCUS ON CRIMINOLOGY: Can You Tell a Fraud When You See One?
FOCUS ON EDUCATION: What Can a Fourth-Grader Do with Statistics?
Epilogue: A Perspective on Statistics
Appendix A: z-Score Tables
Appendix B: Table of Random Numbers
Websites and Suggested Readings
Glossary
Credits
Answers
Index
| Sprache | englisch |
|---|---|
| Maße | 150 x 225 mm |
| Gewicht | 22 g |
| Themenwelt | Mathematik / Informatik ► Mathematik ► Statistik |
| Mathematik / Informatik ► Mathematik ► Wahrscheinlichkeit / Kombinatorik | |
| ISBN-10 | 0-13-467852-4 / 0134678524 |
| ISBN-13 | 978-0-13-467852-8 / 9780134678528 |
| Zustand | Neuware |
| Informationen gemäß Produktsicherheitsverordnung (GPSR) | |
| Haben Sie eine Frage zum Produkt? |
aus dem Bereich
