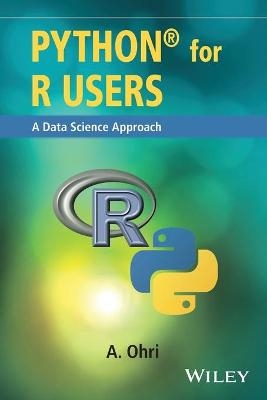
Python for R Users
John Wiley & Sons Inc (Verlag)
978-1-119-12676-8 (ISBN)
The first book of its kind, Python for R Users: A Data Science Approach makes it easy for R programmers to code in Python and Python users to program in R. Short on theory and long on actionable analytics, it provides readers with a detailed comparative introduction and overview of both languages and features concise tutorials with command-by-command translations—complete with sample code—of R to Python and Python to R.
Following an introduction to both languages, the author cuts to the chase with step-by-step coverage of the full range of pertinent programming features and functions, including data input, data inspection/data quality, data analysis, and data visualization. Statistical modeling, machine learning, and data mining—including supervised and unsupervised data mining methods—are treated in detail, as are time series forecasting, text mining, and natural language processing.
• Features a quick-learning format with concise tutorials and actionable analytics
• Provides command-by-command translations of R to Python and vice versa
• Incorporates Python and R code throughout to make it easier for readers to compare and contrast features in both languages
• Offers numerous comparative examples and applications in both programming languages
• Designed for use for practitioners and students that know one language and want to learn the other
• Supplies slides useful for teaching and learning either software on a companion website
Python for R Users: A Data Science Approach is a valuable working resource for computer scientists and data scientists that know R and would like to learn Python or are familiar with Python and want to learn R. It also functions as textbook for students of computer science and statistics.
A. Ohri is the founder of Decisionstats.com and currently works as a senior data scientist. He has advised multiple startups in analytics off-shoring, analytics services, and analytics education, as well as using social media to enhance buzz for analytics products. Mr. Ohri's research interests include spreading open source analytics, analyzing social media manipulation with mechanism design, simpler interfaces for cloud computing, investigating climate change and knowledge flows. His other books include R for Business Analytics and R for Cloud Computing.
A. Ohri is the founder of Decisionstats.com and currently works as a senior data scientist. He has advised multiple startups in analytics off-shoring, analytics services, and analytics education, as well as using social media to enhance buzz for analytics products. Mr. Ohri's research interests include spreading open source analytics, analyzing social media manipulation with mechanism design, simpler interfaces for cloud computing, investigating climate change and knowledge flows. His other books include R for Business Analytics and R for Cloud Computing.
Preface xi
Acknowledgments xv
Scope xvii
Purpose xix
Plan xxi
The Zen of Python xxiii
1 Introduction to Python R and Data Science 1
1.1 What Is Python? 1
1.2 What Is R? 2
1.3 What Is Data Science? 3
1.4 The Future for Data Scientists 3
1.5 What Is Big Data? 4
1.6 Business Analytics Versus Data Science 6
1.6.1 Defining Analytics 6
1.7 Tools Available to Data Scientists 7
1.7.1 Guide to Data Science Cheat Sheets 7
1.8 Packages in Python for Data Science 8
1.9 Similarities and Differences between Python and R 9
1.9.1 Why Should R Users Learn More about Python? 10
1.9.2 Why Should Python Users Learn More about R? 10
1.10 Tutorials 10
1.11 Using R and Python Together 11
1.11.1 Using R Code for Regression and Passing to Python 11
1.12 Other Software and Python 15
1.13 Using SAS with Jupyter 15
1.14 How Can You Use Python and R for Big Data Analytics? 15
1.15 What Is Cloud Computing? 16
1.16 How Can You Use Python and R on the Cloud? 17
1.17 Commercial Enterprise and Alternative Versions of Python and R 18
1.17.1 Commonly Used Linux Commands for Data Scientists 20
1.17.2 Learning Git 20
1.18 Data]Driven Decision Making: A Note 38
1.18.1 Strategy Frameworks in Business Management: A Refresher for Non]MBAs and MBAs Who Have to Make Data]Driven Decisions 39
1.18.2 Additional Frameworks for Business Analysis 45
Bibliography 49
2 Data Input 51
2.1 Data Input in Pandas 51
2.2 Web Scraping Data Input 54
2.2.1 Request Data from URL 55
2.3 Data Input from RDBMS 60
2.3.1 Windows Tutorial 62
2.3.2 137 Mb Installer 63
2.3.3 Configuring ODBC 65
3 Data Inspection and Data Quality 77
3.1 Data Formats 77
3.1.1 Converting Strings to Date Time in Python 78
3.1.2 Converting Data Frame to NumPy Arrays and Back in Python 81
3.2 Data Quality 84
3.3 Data Inspection 88
3.3.1 Missing Value Treatment 91
3.4 Data Selection 92
3.4.1 Random Selection of Data 94
3.4.2 Conditional Selection 95
3.5 Data Inspection in R 98
3.5.1 Diamond Dataset from ggplot2 Package in R 106
3.5.2 Modifying Date Formats and Strings in R 113
3.5.3 Managing Strings in R 116
Bibliography 118
4 Exploratory Data Analysis 119
4.1 Group by Analysis 119
4.2 Numerical Data 119
4.3 Categorical Data 121
5 Statistical Modeling 139
5.1 Concepts in Regression 139
5.1.1 OLS 140
5.1.2 R]Squared 141
5.1.3 p]Value 141
5.1.4 Outliers 141
5.1.5 Multicollinearity and Heteroscedascity 142
5.2 Correlation Is Not Causation 142
5.2.1 A Note on Statistics for Data Scientists 143
5.2.2 Measures of Central Tendency 145
5.2.3 Measures of Dispersion 145
5.2.4 Probability Distribution 147
5.3 Linear Regression in R and Python 154
5.4 Logistic Regression in R and Python 187
5.4.1 Additional Concepts 194
5.4.2 ROC Curve and AUC 194
5.4.3 Bias Versus Variance 194
References 196
6 Data Visualization 197
6.1 Concepts on Data Visualization 197
6.1.1 History of Data Visualization 197
6.1.2 Anscombe Case Study 200
6.1.3 Importing Packages 201
6.1.4 Taking Means and Standard Deviations 202
6.1.5 Conclusion 204
6.1.6 Data Visualization 204
6.1.7 Conclusion 207
6.2 Tufte’s Work on Data Visualization 207
6.3 Stephen Few on Dashboard Design 208
6.3.1 Maeda on Design 209
6.4 Basic Plots 210
6.5 Advanced Plots 219
6.6 Interactive Plots 223
6.7 Spatial Analytics 223
6.8 Data Visualization in R 224
6.8.1 A Note of Sharing Your R Code by RStudio IDE 232
6.8.2 A Note on Sharing Your Jupyter Notebook 233
Bibliography 235
6.8.3 Special Note: A Complete Wing to Wing Tutorial on Python 236
7 Machine Learning Made Easier 251
7.1 Deleting Columns We Dont Need in the Final Decision Tree Model 259
7.1.1 Decision Trees in R 276
7.2 Time Series 294
7.3 Association Analysis 301
7.4 Cleaning Corpus and Making Bag of Words 316
7.4.1 Cluster Analysis 319
7.4.2 Cluster Analysis in Python 319
8 Conclusion and Summary 331
Index 333
| Erscheinungsdatum | 27.11.2016 |
|---|---|
| Verlagsort | New York |
| Sprache | englisch |
| Maße | 150 x 226 mm |
| Gewicht | 499 g |
| Themenwelt | Mathematik / Informatik ► Informatik ► Web / Internet |
| Mathematik / Informatik ► Mathematik ► Computerprogramme / Computeralgebra | |
| Mathematik / Informatik ► Mathematik ► Wahrscheinlichkeit / Kombinatorik | |
| ISBN-10 | 1-119-12676-2 / 1119126762 |
| ISBN-13 | 978-1-119-12676-8 / 9781119126768 |
| Zustand | Neuware |
| Informationen gemäß Produktsicherheitsverordnung (GPSR) | |
| Haben Sie eine Frage zum Produkt? |
aus dem Bereich


