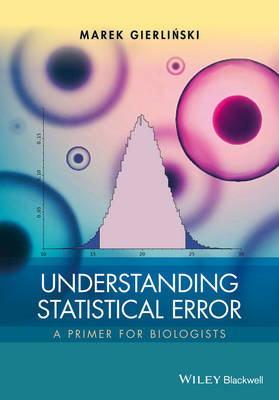
Understanding Statistical Error
Wiley-Blackwell (Verlag)
978-1-119-10691-3 (ISBN)
- Titel z.Zt. nicht lieferbar
- Versandkostenfrei innerhalb Deutschlands
- Auch auf Rechnung
- Verfügbarkeit in der Filiale vor Ort prüfen
- Artikel merken
Understanding Statistical Error - A Primer for Biologists:
Introduces the essential topic of error analysis to biologists
Contains mathematics at a level that all biologists can grasp
Presents the formulas required to calculate each confidence interval for use in practice
Is based on a successful series of lectures from the author’s established course
Assuming no prior knowledge of statistics, this book covers the central topics needed for efficient data analysis, ranging from probability distributions, statistical estimators, confidence intervals, error propagation and uncertainties in linear regression, to advice on how to use error bars in graphs properly. Using simple mathematics, all these topics are carefully explained and illustrated with figures and worked examples. The emphasis throughout is on visual representation and on helping the reader to approach the analysis of experimental data with confidence.
This useful guide explains how to evaluate uncertainties of key parameters, such as the mean, median, proportion and correlation coefficient. Crucially, the reader will also learn why confidence intervals are important and how they compare against other measures of uncertainty.
Understanding Statistical Error - A Primer for Biologists can be used both by students and researchers to deepen their knowledge and find practical formulae to carry out error analysis calculations. It is a valuable guide for students, experimental biologists and professional researchers in biology, biostatistics, computational biology, cell and molecular biology, ecology, biological chemistry, drug discovery, biophysics, as well as wider subjects within life sciences and any field where error analysis is required.
Dr Marek Gierlinski is a bioinformatician at College of Life Science, University of Dundee, UK. He attained his PhD in astrophysics and studied X-ray emission from black holes and neutron stars for many years. In 2009 he started a new career in bioinformatics, bringing his knowledge and skills in statistics and data analysis to a biological institute. He works on a variety of topics, including proteomics, DNA and RNA sequencing, imaging and numerical modelling.
Introduction 1
Why would you read an introduction? 1
What is this book about? 1
Who is this book for? 2
About maths 2
Acknowledgements 3
Chapter 1 Why do we need to evaluate errors? 4
Chapter 2 Probability distributions 7
2.1 Random variables 8
2.2 What is a probability distribution? 9
Probability distribution of a discrete variable 9
Probability distribution of a continuous variable 10
Cumulative probability distribution 11
2.3 Mean, median, variance and standard deviation 11
2.4 Gaussian distribution 13
Example: estimate an outlier 15
2.5 Central limit theorem 16
2.6 Log-normal distribution 18
2.7 Binomial distribution 20
2.8 Poisson distribution 23
Classic example: horse kicks 25
Inter-arrival times 26
2.9 Student’s t-distribution 28
2.10 Exercises 30
Chapter 3 Measurement errors 32
3.1 Where do errors come from? 32
Systematic errors 33
Random errors 34
3.2 Simple model of random measurement errors 35
3.3 Intrinsic variability 38
3.4 Sampling error 39
Sampling in time 39
3.5 Simple measurement errors 41
Reading error 41
Counting error 43
3.6 Exercises 46
Chapter 4 Statistical estimators 47
4.1 Population and sample 47
4.2 What is a statistical estimator? 49
4.3 Estimator bias 52
4.4 Commonly used statistical estimators 53
Mean 53
Weighted mean 54
Geometric mean 55
Median 56
Standard deviation 57
Unbiased estimator of standard deviation 59
Mean deviation 62
Pearson’s correlation coefficient 63
Proportion 65
4.5 Standard error 66
4.6 Standard error of the weighted mean 70
4.7 Error in the error 71
4.8 Degrees of freedom 72
4.9 Exercises 73
Chapter 5 Confidence intervals 74
5.1 Sampling distribution 75
5.2 Confidence interval: what does it really mean? 77
5.3 Why 95%? 79
5.4 Confidence interval of the mean 80
Example 83
5.5 Standard error versus confidence interval 84
How many standard errors are in a confidence interval? 84
What is the confidence of the standard error? 85
5.6 Confidence interval of the median 86
Simple approximation 89
Example 89
5.7 Confidence interval of the correlation coefficient 90
Significance of correlation 93
5.8 Confidence interval of a proportion 95
5.9 Confidence interval for count data 99
Simple approximation 102
Errors on count data are not integers 102
5.10 Bootstrapping 103
5.11 Replicates 105
Sample size to find the mean 108
5.12 Exercises 109
Chapter 6 Error bars 112
6.1 Designing a good plot 112
Elements of a good plot 113
Lines in plots 115
A digression on plot labels 116
Logarithmic plots 117
6.2 Error bars in plots 118
Various types of errors 119
How to draw error bars 120
Box plots 121
Bar plots 123
Pie charts 128
Overlapping error bars 128
6.3 When can you get away without error bars? 130
On a categorical variable 130
When presenting raw data 130
Large groups of data points 130
When errors are small and negligible 131
Where errors are not known 131
6.4 Quoting numbers and errors 132
Significant figures 132
Writing significant figures 133
Errors and significant figures 135
Error with no error 137
Computer-generated numbers 138
Summary 140
6.5 Exercises 140
Chapter 7 Propagation of errors 142
7.1 What is propagation of errors? 142
7.2 Single variable 143
Scaling 144
Logarithms 144
7.3 Multiple variables 146
Sum or difference 146
Ratio or product 147
7.4 Correlated variables 149
7.5 To use error propagation or not? 150
7.6 Example: distance between two dots 151
7.7 Derivation of the error propagation formula for one variable 153
7.8 Derivation of the error propagation formula for multiple variables 155
7.9 Exercises 157
Chapter 8 Errors in simple linear regression 158
8.1 Linear relation between two variables 158
Mean response 159
True response and noise 160
Data linearization 161
8.2 Straight line fit 161
8.3 Confidence intervals of linear fit parameters 164
Example 168
8.4 Linear fit prediction errors 170
8.5 Regression through the origin 173
Example 174
8.6 General curve fitting 175
8.7 Derivation of errors on fit parameters 178
8.8 Exercises 179
Chapter 9 Worked example 181
9.1 The experiment 181
9.2 Results 182
Sasha 183
Lyosha 186
Masha 189
9.3 Discussion 190
9.4 The final paragraph 192
Solutions to exercises 193
Appendix A 206
Bibliography 209
Index 211
| Verlagsort | Hoboken |
|---|---|
| Sprache | englisch |
| Maße | 170 x 244 mm |
| Gewicht | 349 g |
| Themenwelt | Mathematik / Informatik ► Mathematik ► Angewandte Mathematik |
| Naturwissenschaften ► Biologie | |
| ISBN-10 | 1-119-10691-5 / 1119106915 |
| ISBN-13 | 978-1-119-10691-3 / 9781119106913 |
| Zustand | Neuware |
| Haben Sie eine Frage zum Produkt? |
aus dem Bereich


