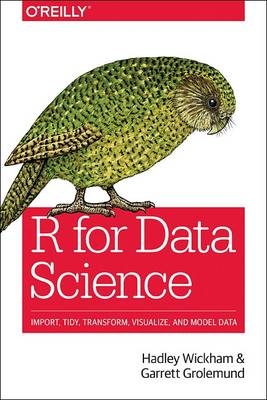
R for Data Science
O'Reilly Media (Verlag)
978-1-4919-1039-9 (ISBN)
- Titel ist leider vergriffen;
keine Neuauflage - Artikel merken
Suitable for readers with no previous programming experience, R for Data Science is designed to get you doing data science as quickly as possible.
Authors Hadley Wickham and Garrett Grolemund guide you through the steps of importing, wrangling, exploring, and modeling your data and communicating the results.
You’ll get a complete, big-picture understanding of the data science cycle, along with basic tools you need to manage the details. Each section of the book is paired with exercises to help you practice what you’ve learned along the way.
You’ll learn how to:
Wrangle—transform your datasets into a form convenient for analysis
Program—learn powerful R tools for solving data problems with greater clarity and ease
Explore—examine your data, generate hypotheses, and quickly test them
Model—provide a low-dimensional summary that captures true "signals" in your dataset
Communicate—learn R Markdown for integrating prose, code, and results
Hadley Wickham is an Assistant Professor and the Dobelman Family Junior Chair in Statistics at Rice University. He is an active member of the R community, has written and contributed to over 30 R packages, and won the John Chambers Award for Statistical Computing for his work developing tools for data reshaping and visualization. His research focuses on how to make data analysis better, faster and easier, with a particular emphasis on the use of visualization to better understand data and models.
Garrett Grolemund is a statistician, teacher and R developer who currently works for RStudio. He sees data analysis as a largely untapped fountain of value for both industry and science. Garrett received his Ph.D at Rice University in Hadley Wickham's lab, where his research traced the origins of data analysis as a cognitive process and identified how attentional and epistemological concerns guide every data analysis.
Explore
Chapter 1Data Visualization with ggplot2
Introduction
First Steps
Aesthetic Mappings
Common Problems
Facets
Geometric Objects
Statistical Transformations
Position Adjustments
Coordinate Systems
The Layered Grammar of Graphics
Chapter 2Workflow: Basics
Coding Basics
What’s in a Name?
Calling Functions
Chapter 3Data Transformation with dplyr
Introduction
Filter Rows with filter()
Arrange Rows with arrange()
Select Columns with select()
Add New Variables with mutate()
Grouped Summaries with summarize()
Grouped Mutates (and Filters)
Chapter 4Workflow: Scripts
Running Code
RStudio Diagnostics
Chapter 5Exploratory Data Analysis
Introduction
Questions
Variation
Missing Values
Covariation
Patterns and Models
ggplot2 Calls
Learning More
Chapter 6Workflow: Projects
What Is Real?
Where Does Your Analysis Live?
Paths and Directories
RStudio Projects
Summary
Wrangle
Chapter 7Tibbles with tibble
Introduction
Creating Tibbles
Tibbles Versus data.frame
Interacting with Older Code
Chapter 8Data Import with readr
Introduction
Getting Started
Parsing a Vector
Parsing a File
Writing to a File
Other Types of Data
Chapter 9Tidy Data with tidyr
Introduction
Tidy Data
Spreading and Gathering
Separating and Pull
Missing Values
Case Study
Nontidy Data
Chapter 10Relational Data with dplyr
Introduction
nycflights13
Keys
Mutating Joins
Filtering Joins
Join Problems
Set Operations
Chapter 11Strings with stringr
Introduction
String Basics
Matching Patterns with Regular Expressions
Tools
Other Types of Pattern
Other Uses of Regular Expressions
stringi
Chapter 12Factors with forcats
Introduction
Creating Factors
General Social Survey
Modifying Factor Order
Modifying Factor Levels
Chapter 13Dates and Times with lubridate
Introduction
Creating Date/Times
Date-Time Components
Time Spans
Time Zones
Program
Chapter 14Pipes with magrittr
Introduction
Piping Alternatives
When Not to Use the Pipe
Other Tools from magrittr
Chapter 15Functions
Introduction
When Should You Write a Function?
Functions Are for Humans and Computers
Conditional Execution
Function Arguments
Return Values
Environment
Chapter 16Vectors
Introduction
Vector Basics
Important Types of Atomic Vector
Using Atomic Vectors
Recursive Vectors (Lists)
Attributes
Augmented Vectors
Chapter 17Iteration with purrr
Introduction
For Loops
For Loop Variations
For Loops Versus Functionals
The Map Functions
Dealing with Failure
Mapping over Multiple Arguments
Walk
Other Patterns of For Loops
Model
Chapter 18Model Basics with modelr
Introduction
A Simple Model
Visualizing Models
Formulas and Model Families
Missing Values
Other Model Families
Chapter 19Model Building
Introduction
Why Are Low-Quality Diamonds More Expensive?
What Affects the Number of Daily Flights?
Learning More About Models
Chapter 20Many Models with purrr and broom
Introduction
gapminder
List-Columns
Creating List-Columns
Simplifying List-Columns
Making Tidy Data with broom
Communicate
Chapter 21R Markdown
Introduction
R Markdown Basics
Text Formatting with Markdown
Code Chunks
Troubleshooting
YAML Header
Learning More
Chapter 22Graphics for Communication with ggplot2
Introduction
Label
Annotations
Scales
Zooming
Themes
Saving Your Plots
Learning More
Chapter 23R Markdown Formats
Introduction
Output Options
Documents
Notebooks
Presentations
Dashboards
Interactivity
Websites
Other Formats
Learning More
Chapter 24R Markdown Workflow
| Erscheint lt. Verlag | 31.1.2017 |
|---|---|
| Zusatzinfo | colour illustrations |
| Verlagsort | Sebastopol |
| Sprache | englisch |
| Maße | 154 x 228 mm |
| Gewicht | 794 g |
| Einbandart | kartoniert |
| Themenwelt | Informatik ► Datenbanken ► Data Warehouse / Data Mining |
| Mathematik / Informatik ► Mathematik ► Computerprogramme / Computeralgebra | |
| Schlagworte | Data Analysis • Data Science • Datenanalyse • Programmiersprache R • R (Programmiersprache) • Statistik |
| ISBN-10 | 1-4919-1039-9 / 1491910399 |
| ISBN-13 | 978-1-4919-1039-9 / 9781491910399 |
| Zustand | Neuware |
| Informationen gemäß Produktsicherheitsverordnung (GPSR) | |
| Haben Sie eine Frage zum Produkt? |
aus dem Bereich


