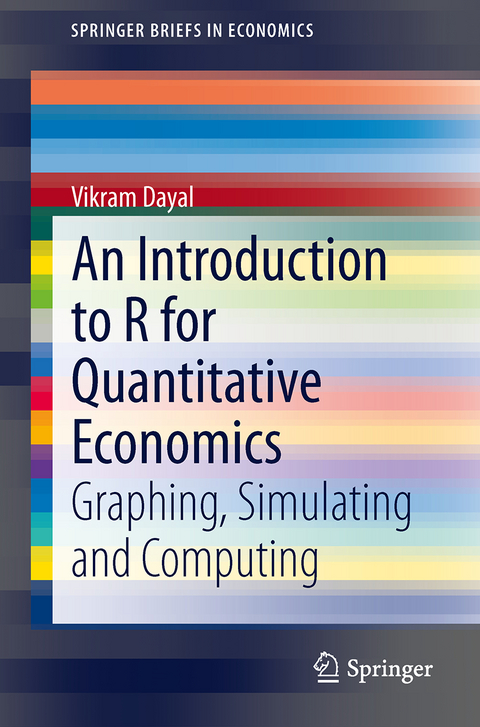
An Introduction to R for Quantitative Economics
Springer, India, Private Ltd (Verlag)
978-81-322-2339-9 (ISBN)
Vikram Dayal is an Associate Professor at the Institute of Economic Growth, Delhi. He is the author of the book titled The Environment in Economics and Development: Pluralist Extensions of Core Economic Models, published in the SpringerBriefs in Economics series in 2014. In 2009 he co-edited the Oxford Handbook of Environmental Economics in India with Professor Kanchan Chopra. He has been incorporating the use of software in teaching quantitative economics—his open access notes on Simulating to understand mathematics for economics with Excel and R are downloadable at http(colon)(double back slash)textbookrevolution(dot)org. His research on a range of environmental and developmental issues from outdoor and indoor air pollution in Goa, India to tigers and Prosopis juliflora in Ranthambhore National Park has been published in a variety of journals. He visited the Workshop in Political Theory and Policy Analysis in Bloomington, Indiana as a SANDEE (South Asian Network for Development and Environmental Economics) Partha Dasgupta Fellow in 2011. He studied economics in India and the USA and did his doctoral degree from the University of Delhi.
Chapter 1. Introduction.- Chapter 2. R and RStudio.- Chapter 3. Getting data into R.- Chapter 4. Supply and demand.- Chapter 5. Functions.- Chapter 6. The Cobb-Douglas Function.- Chapter 7. Matrices.- Chapter 8. Statistical simulation.- Chapter 9. Anscombe's quartet: graphs can reveal.- Chapter 10. Carbon and forests: graphs and regression.- Chapter 11. Evaluating training.- Chapter 12. The Solow growth model.- Chapter 13. Simulating random walks and shing cycles.- Chapter 14. Basic time series.
| Reihe/Serie | SpringerBriefs in Economics |
|---|---|
| Zusatzinfo | 9 Illustrations, color; 70 Illustrations, black and white; XV, 109 p. 79 illus., 9 illus. in color. |
| Verlagsort | New Delhi |
| Sprache | englisch |
| Maße | 155 x 235 mm |
| Themenwelt | Informatik ► Grafik / Design ► Digitale Bildverarbeitung |
| Mathematik / Informatik ► Informatik ► Software Entwicklung | |
| Mathematik / Informatik ► Mathematik ► Computerprogramme / Computeralgebra | |
| Wirtschaft ► Allgemeines / Lexika | |
| Wirtschaft ► Volkswirtschaftslehre ► Ökonometrie | |
| Schlagworte | Applied Econometrics • Quantitative Economics • R software • Simulation • Visualizing Data |
| ISBN-10 | 81-322-2339-X / 813222339X |
| ISBN-13 | 978-81-322-2339-9 / 9788132223399 |
| Zustand | Neuware |
| Haben Sie eine Frage zum Produkt? |
aus dem Bereich


