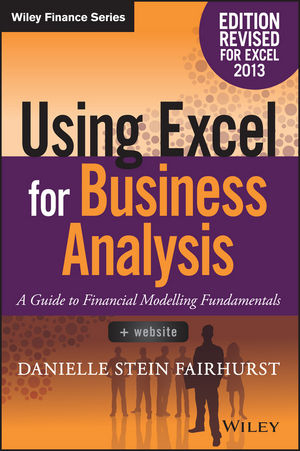
Using Excel for Business Analysis
John Wiley & Sons Inc (Verlag)
978-1-119-06246-2 (ISBN)
- Titel erscheint in neuer Auflage
- Artikel merken
Utilise Excel 2013 capabilities to build effective financial models Using Excel for Business Analysis, Revised Edition provides practical guidance for anyone looking to build financial models. Whether for business proposals, opportunity evaluation, financial reports, or any other business finance application, this book shows you how to design, create, and test your model, then present your results effectively using Excel 2013. The book opens with a general guide to financial modelling, with each subsequent chapter building skill upon skill until you have a real, working model of your own. Financial tools, features, and functions are covered in detail from a practical perspective, and put in context with application to real-world examples. Each chapter focuses on a different aspect of Excel modelling, including step-by-step instructions that walk you through each feature, and the companion website provides live model worksheets that give you the real hands-on practice you need to start doing your job faster, more efficiently, and with fewer errors.
Financial modelling is an invaluable business tool, and Excel 2013 is capable of supporting the most common and useful models most businesses need. This book shows you how to dig deeper into Excel's functionality to craft effective financial models and provide important information that informs good decision-making. * Learn financial modelling techniques and best practice * Master the formulas and functions that bring your model to life * Apply stress testing and sensitivity analysis with advanced conditionals * Present your results effectively, whether graphically, orally, or written A deceptively powerful application, Excel supports many hundreds of tools, features, and functions; Using Excel for Business Analysis eliminates the irrelevant to focus on those that are most useful to business finance users, with detailed guidance toward utilisation and best practice.
DANIELLE STEIN FAIRHURST is the Principal of Plum Solutions, a Sydney-based consultancy specialising in financial modelling and analysis. Her extensive experience as a financial analyst enables her to help her clients create meaningful financial models. She is regularly engaged as a speaker, course facilitator, financial modelling consultant, and analyst. Using Excel for Business Analysis: A Guide to Financial Modelling Fundamentals, Edition Revised for Excel 2013 provides additional resources, explanations, information pertinent to users of older Excel versions, and more on the companion website at www.wiley.com/go/steinfairhurstrevised.
Preface ix CHAPTER 1 What Is Financial Modelling? 1 What s the Difference between a Spreadsheet and a Financial Model? 4 Types and Purposes of Financial Models 5 Tool Selection 6 What Skills Do You Need to Be a Good Financial Modeller? 17 The Ideal Financial Modeller 24 Summary 28 CHAPTER 2 Building a Model 31 Model Design 31 The Golden Rules for Model Design 33 Design Issues 35 The Workbook Anatomy of a Model 36 Project Planning Your Model 38 Model Layout Flow Charting 41 Steps to Building a Model 41 Information Requests 50 Version-Control Documentation 51 Summary 53 CHAPTER 3 Best Practice Principles of Modelling 55 Document Your Assumptions 55 Linking, Not Hard Coding 56 Enter Data Only Once 57 Avoid Bad Habits 57 Use Consistent Formulas 57 Format and Label Clearly 58 Methods and Tools of Assumptions Documentation 59 Linked Dynamic Text Assumptions Documentation 67 What Makes a Good Model? 70 Summary 72 CHAPTER 4 Financial Modelling Techniques 73 The Problem with Excel 73 Error Avoidance Strategies 75 How Long Should a Formula Be? 81 Linking to External Files 83 Building Error Checks 86 Summary 96 CHAPTER 5 Using Excel in Financial Modelling 97 Formulas and Functions in Excel 97 Excel Versions 101 Handy Excel Shortcuts 103 Basic Excel Functions 109 Logical Functions 112 Nesting: Combining Simple Functions to Create Complex Formulas 115 Cell Referencing Best Practices 119 Named Ranges 122 Summary 126 CHAPTER 6 Functions for Financial Modelling 127 Aggregation Functions 127 LOOKUP Formulas 140 Nesting INDEX and MATCH 153 OFFSET Function 157 Regression Analysis 161 CHOOSE Function 164 Working with Dates 166 Financial Project Evaluation Functions 174 Loan Calculations 180 Summary 186 CHAPTER 7 Tools for Model Display 187 Basic Formatting 187 Custom Formatting 187 Conditional Formatting 193 Sparklines 200 Bulletproofing Your Model 204 Customising the Display Settings 208 Form Controls 216 Summary 232 CHAPTER 8 Tools for Financial Modelling 233 Hiding Sections of a Model 233 Grouping 238 Array Formulas 240 Goal Seeking 247 Structured Reference Tables 249 PivotTables 251 Macros 262 Summary 272 CHAPTER 9 Common Uses of Tools in Financial Modelling 273 Escalation Methods for Modelling 273 Understanding Nominal and Effective (Real) Rates 278 Calculating Cumulative Totals 283 How to Calculate a Payback Period 284 Weighted Average Cost of Capital (WACC) 288 Building a Tiering Table 293 Modelling Depreciation Methods 296 Break-Even Analysis 307 Summary 313 CHAPTER 10 Model Review 315 Rebuilding an Inherited Model 315 Improving Model Performance 323 Auditing a Financial Model 328 Summary 335 Appendix 10.1: QA Log 336 CHAPTER 11 Stress-Testing, Scenarios, and Sensitivity Analysis in Financial Modelling 337 What Are the Differences between Scenario, Sensitivity, and What-If Analyses? 338 Overview of Scenario Analysis Tools and Methods 340 Advanced Conditional Formatting 349 Comparing Scenario Methods 353 Summary 365 CHAPTER 12 Presenting Model Output 367 Preparing an Oral Presentation for Model Results 367 Preparing a Graphic or Written Presentation for Model Results 369 Chart Types 372 Working with Charts 380 Handy Charting Hints 386 Dynamic Named Ranges 388 Charting with Two Different Axes and Chart Types 394 Bubble Charts 400 Creating a Dynamic Chart 402 Waterfall Charts 407 Summary 420 About the Author 421 About the Website 423 Index 425
| Erscheint lt. Verlag | 22.5.2015 |
|---|---|
| Verlagsort | New York |
| Sprache | englisch |
| Maße | 155 x 229 mm |
| Gewicht | 574 g |
| Themenwelt | Informatik ► Office Programme ► Excel |
| Mathematik / Informatik ► Mathematik ► Finanz- / Wirtschaftsmathematik | |
| Wirtschaft ► Betriebswirtschaft / Management ► Finanzierung | |
| ISBN-10 | 1-119-06246-2 / 1119062462 |
| ISBN-13 | 978-1-119-06246-2 / 9781119062462 |
| Zustand | Neuware |
| Informationen gemäß Produktsicherheitsverordnung (GPSR) | |
| Haben Sie eine Frage zum Produkt? |
aus dem Bereich


