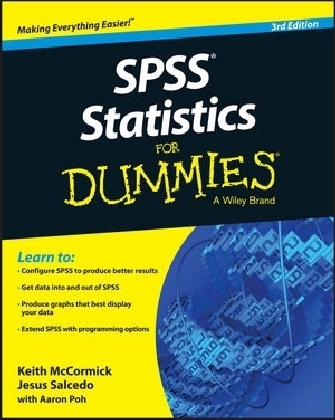
SPSS Statistics for Dummies
John Wiley & Sons Inc (Verlag)
978-1-118-98901-2 (ISBN)
- Titel erscheint in neuer Auflage
- Artikel merken
Install and configure SPSS and learn the basics of how it works Master the process of getting data into SPSS and manipulating it to produce results See how to display data in dozens of different graphic formats to fit specific needs Make SPSS manufacture the numbers you want and take advantage of the many analysis options Discover ways to customize the SPSS interface and the look of your results, edit graphics and pivot tables, and program SPSS with Command Syntax Statistical analysis is crucial to so many industries, and accuracy and efficiency are crucial. SPSS offers you the capability to deliver, but you still must know how to take utmost advantage of the tools at your fingertips. SPSS Statistics For Dummies shows you how to handle data like a pro, with step-by-step instruction and expert advice.
Keith McCormick is an independent predictive analytics consultant, speaker, trainer, and author. Keith is the lead author of the IBM SPSS Modeler Cookbook. Jesus Salcedo is QueBIT's Director of Advanced Analytics Training and the former SPSS Curriculum Team Lead for IBM. Both have done extensive SPSS training. Aaron Poh is a business analyst supporting IT strategy, enterprise architecture, and analytics at Booz Allen Hamilton and serves as a director at the Institute for Supply Management Northern Virginia.
Introduction 1 Part I: Getting Started with SPSS 5 Chapter 1: Introducing SPSS 7 Chapter 2: Installing SPSS 15 Chapter 3: A Simple Statistical Analysis Example 23 Part II: Getting Data in and out of SPSS 43 Chapter 4: Entering and Defining Data 45 Chapter 5: Opening Data Files 63 Chapter 6: Getting Data and Results out of SPSS 81 Chapter 7: More About Defining Your Data 99 Part III: Messing with Data in SPSS 113 Chapter 8: The Transform and Data Menus 115 Chapter 9: Using Functions 135 Chapter 10: Manipulating Files 143 Part IV: Graphing Data 157 Chapter 11: On the Menu: Graphing Choices in SPSS 159 Chapter 12: Building Graphs Using the Chart Builder 175 Part V: Analyzing Data 199 Chapter 13: Using Descriptive Statistics 201 Chapter 14: Showing Relationships between Categorical Dependent and Independent Variables 217 Chapter 15: Showing Relationships between Continuous Dependent and Categorical Independent Variables 235 Chapter 16: Showing Relationships between Continuous Dependent and Independent Variables 249 Part VI: Making SPSS Your Own: Settings, Templates, and Looks 263 Chapter 17: Changing Settings 265 Chapter 18: Editing Charts and Chart Templates 283 Chapter 19: Editing Tables 293 Part VII: Programming SPSS with Command Syntax 303 Chapter 20: Getting Acquainted with Syntax 305 Chapter 21: Adding Syntax to Your Toolkit 311 Part VIII: The Part of Tens 321 Chapter 22: Ten (Or So) Modules You Can Add to SPSS 323 Chapter 23: Ten (Or So) Useful SPSS Online Resources 333 Chapter 24: Ten Professional Development Projects for SPSS Users 341 Glossary 347 Index 355
| Erscheint lt. Verlag | 3.7.2015 |
|---|---|
| Verlagsort | New York |
| Sprache | englisch |
| Maße | 192 x 243 mm |
| Gewicht | 542 g |
| Themenwelt | Mathematik / Informatik ► Mathematik ► Computerprogramme / Computeralgebra |
| Mathematik / Informatik ► Mathematik ► Wahrscheinlichkeit / Kombinatorik | |
| ISBN-10 | 1-118-98901-5 / 1118989015 |
| ISBN-13 | 978-1-118-98901-2 / 9781118989012 |
| Zustand | Neuware |
| Haben Sie eine Frage zum Produkt? |
aus dem Bereich


