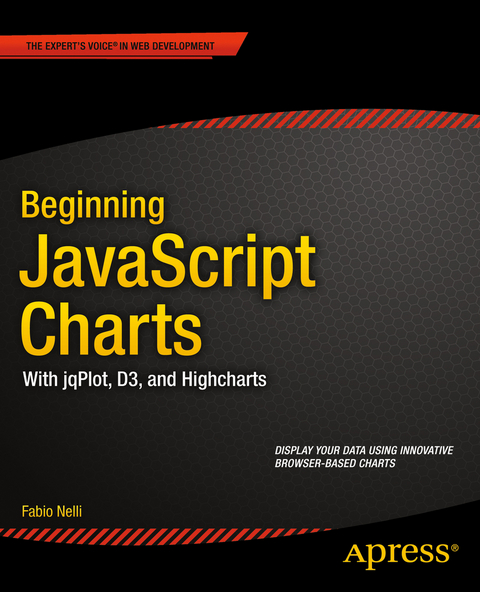
Beginning JavaScript Charts
Apress (Verlag)
978-1-4302-6289-3 (ISBN)
Create all kinds of charts using the latest technologies available on browsers (HTML5, CSS3, jQuery, jqPlot, D3, Highcharts, and SVG)
Full of step-by-step examples, Beginning JavaScript Charts introduces you gradually to all aspects of chart development, from the data source to the choice of which solution to apply.
This book provides a number of tools that can be the starting point for any project requiring graphical representations of data, whether using commercial libraries or your own
Fabio Nelli, is an IT Scientific Application Specialist at IRBM Science Park, a private research center in Pomezia, Roma (Italy). He has beena computer consultant for many years at IBM, EDS, Merck Sharp, and Dohme, along with several banks and insurance companies.He has an Organic Chemistry degree and many years of experience in Information technologies and Automation systems applied to Life Sciences (Tech Specialist at Beckman Coulter Italy and Spain).He is currently developing Java applications that interface Oracle databases with scientific instrumentations generating data and web server applications providing analysis of the results to researchers in real time.
* Charting Technology Overview * jQuery Basics * Simple HTML Tables * Drawing a Line Chart * Drawing a Bar Chart * Drawing a Pie Chart * Creating a Library for Simple Charts * Introducing jqPlot * Line Charts with jqPlot * Bar Charts with jqPlot * Pie Charts with jqPlot * Candlestick Charts with jqPlot * Bubble Charts with jqPlot * Other Charts with jqPlot * Adding Controls to Charts * Embedding jqPlot Charts in jQuery Widgets * Handling Input Data * Moving from jqPlot to Highcharts * Introducing D3 * Line Charts with D3 * Bar Charts with D3 * Pie Charts with D3 * Candlestick Charts with D3 * Scatterplot and Bubble Charts with D3 * Radar Charts with D3 * Handling Live Data with D3 * App A: Guidelines for the Examples in the Book * App B: jqPlot Plugins
| Erscheint lt. Verlag | 13.12.2013 |
|---|---|
| Zusatzinfo | 388 Illustrations, black and white; XXI, 620 p. 388 illus. |
| Verlagsort | Berlin |
| Sprache | englisch |
| Maße | 178 x 254 mm |
| Themenwelt | Mathematik / Informatik ► Informatik ► Betriebssysteme / Server |
| Mathematik / Informatik ► Informatik ► Software Entwicklung | |
| Mathematik / Informatik ► Informatik ► Web / Internet | |
| ISBN-10 | 1-4302-6289-3 / 1430262893 |
| ISBN-13 | 978-1-4302-6289-3 / 9781430262893 |
| Zustand | Neuware |
| Haben Sie eine Frage zum Produkt? |
aus dem Bereich


