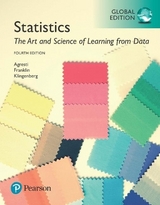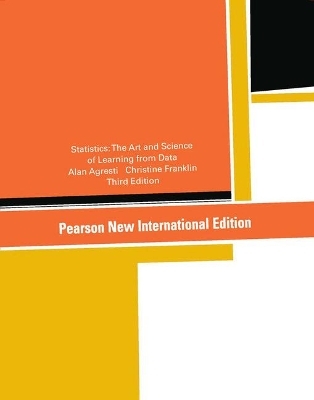
Statistics: Pearson New International Edition
Pearson Education Limited
978-1-292-02118-8 (ISBN)
- Titel erscheint in neuer Auflage
- Artikel merken
Alan Agresti is Distinguished Professor Emeritus in the Department of Statistics at the University of Florida. He taught statistics there for 38 years, including the development of three courses in statistical methods for social science students and three courses in categorical data analysis. He is author of over 100 refereed articles and five texts including "Statistical Methods for the Social Sciences" (with Barbara Finlay, Prentice Hall, 4th edition 2009) and "Categorical Data Analysis" (Wiley, 2nd edition 2002). He is a Fellow of the American Statistical Association and recipient of an Honorary Doctor of Science from De Montfort University in the UK. In 2003 Alan was named "Statistician of the Year" by the Chicago chapter of the American Statistical Association and in 2004 he was the first honoree of the Herman Callaert Leadership Award in Biostatistical Education and Dissemination awarded by the University of Limburgs, Belgium. He has held visiting positions at Harvard University, Boston University, London School of Economics, and Imperial College and has taught courses or short courses for universities and companies in about 30 countries worldwide. Alan has also received teaching awards from UF and an excellence in writing award from John Wiley & Sons. Christine Franklin is a Senior Lecturer and Lothar Tresp Honoratus Honors Professor in the Department of Statistics at the University of Georgia. She has been teaching statistics for more than 30 years at the college level. Chris has been actively involved at the national and state level with promoting statistical education at Pre-K–16 since the 1980s. She is a past Chief Reader for AP Statistic. She has developed three graduate level courses at the University of Georgia in statistics for elementary, middle, and secondary teachers. Chris served as the lead writer for the ASA-endorsed Guidelines for Assessment and Instruction in Statistics Education (GAISE) Report: A Pre- K–12 Curriculum Framework. Chris has been honored by her selection as a Fellow of the American Statistical Association, the 2006 Mu Sigma Rho National Statistical Education Award recipient for her teaching and lifetime devotion to statistics education, and numerous teaching and advising awards at the University of Georgia including election to the UGA Teaching Academy. Chris has written more than 50 journal articles and resource materials for textbooks.
Part 1: Gathering and Exploring Data
1. Statistics: The Art and Science of Learning from Data
1.1 Using Data to Answer Statistical Questions
1.2 Sample Versus Population
1.3 Using Calculators and Computers
Chapter Summary
Chapter Problems
2. Exploring Data with Graphs and Numerical Summaries
2.1 Different Types of Data
2.2 Graphical Summaries of Data
2.3 Measuring the Center of Quantitative Data
2.4 Measuring the Variability of Quantitative Data
2.5 Using Measures of Position to Describe Variability
2.6 Recognizing and Avoiding Misuses of Graphical Summaries
Chapter Summary
Chapter Problems
3. Association: Contingency, Correlation, and Regression
3.1 The Association Between Two Categorical Variables
3.2 The Association Between Two Quantitative Variables
3.3 Predicting the Outcome of a Variable
3.4 Cautions in Analyzing Associations
Chapter Summary
Chapter Problems
4. Gathering Data
4.1 Experimental and Observational Studies
4.2 Good and Poor Ways to Sample
4.3 Good and Poor Ways to Experiment
4.4 Other Ways to Conduct Experimental and Nonexperimental Studies
Chapter Summary
Chapter Problems
Part 1 Review
Part 1 Questions
Part 1 Exercises
Part 2: Probability, Probability Distributions, and Sampling Distributions
5. Probability in Our Daily Lives
5.1 How Probability Quantifies Randomness
5.2 Finding Probabilities
5.3 Conditional Probability: The Probability of A Given B
5.4 Applying the Probability Rules
Chapter Summary
Chapter Problems
6. Probability Distributions
6.1 Summarizing Possible Outcomes and Their Probabilities
6.2 Probabilities for Bell-Shaped Distributions
6.3 Probabilities When Each Observation Has Two Possible Outcomes
Chapter Summary
Chapter Problems
7. Sampling Distributions
7.1 How Sample Proportions Vary Around the Population Proportion
7.2 How Sample Means Vary Around the Population Mean
7.3 The Binomial Distribution Is a Sampling Distribution (Optional)
Chapter Summary
Chapter Problems
Part 2 Review
Part 2 Questions
Part 2 Exercises
Part 3: Inferential Statistics
8. Statistical Inference: Confidence Intervals
8.1 Point and Interval Estimates of Population Parameters
8.2 Constructing a Confidence Interval to Estimate a Population Proportion
8.3 Constructing a Confidence Interval to Estimate a Population Mean
8.4 Choosing the Sample Size for a Study
8.5 Using Computers to Make New Estimation Methods Possible
Chapter Summary
Chapter Problems
9. Statistical Inference: Significance Tests about Hypotheses
9.1 Steps for Performing a Significance Test
9.2 Significance Tests about Proportions
9.3 Significance Tests about Means
9.4 Decisions and Types of Errors in Significance Tests
9.5 Limitations of Significance Tests
9.6 The Likelihood of a Type II Error (Not Rejecting H0, Even Though It’s False)
Chapter Summary
Chapter Problems
10. Comparing Two Groups
10.1 Categorical Response: Comparing Two Proportions
10.2 Quantitative Response: Comparing Two Means
10.3 Other Ways of Comparing Means and Comparing Proportions
10.4 Analyzing Dependent Samples
10.5 Adjusting for the Effects of Other Variables
Chapter Summary
Chapter Problems
Part 3 Review
Part 3 Questions
Part 3 Exercises
| Verlagsort | Harlow |
|---|---|
| Sprache | englisch |
| Maße | 216 x 276 mm |
| Gewicht | 1720 g |
| Themenwelt | Mathematik / Informatik ► Mathematik ► Statistik |
| ISBN-10 | 1-292-02118-7 / 1292021187 |
| ISBN-13 | 978-1-292-02118-8 / 9781292021188 |
| Zustand | Neuware |
| Informationen gemäß Produktsicherheitsverordnung (GPSR) | |
| Haben Sie eine Frage zum Produkt? |
aus dem Bereich
