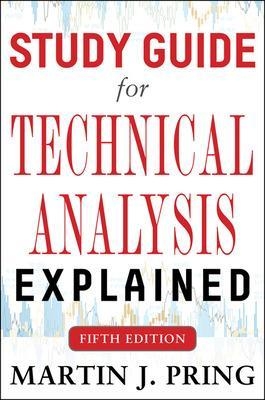
Study Guide for Technical Analysis Explained Fifth Edition
McGraw-Hill Professional (Verlag)
978-0-07-182398-2 (ISBN)
The hands-on STUDY GUIDE to Martin Pring's TECHNICAL ANALYSIS classicTechnical Analysis Explained is the definitive guide for mastering technical analysis. In this hands-on companion, technical analysis wizard Martin Pring serves as your personal investing coach, taking you step-by-step through his long-proven methods.
Packed with hundreds of questions that correspond to chapters and sections throughout the book, Study Guide for Technical Analysis Explained, Fifth Edition, features:
Charts and graphs to help you visually digest the concepts presentedFull text answers to guarantee your complete understanding of each important ideaFill-in-the-blank, multiple-choice, and matching question formatsThe straightforward, no-nonsense style that made Technical Analysis Explained a classic
Technical analysis mastery isn't easy, but its financial rewards make it indispensable. Use Study Guide for Technical Analysis Explained to reach the next level of technical analysis education and ensure that you start every trading day with the skills you need to come out on top.
McGraw-Hill authors represent the leading experts in their fields and are dedicated to improving the lives, careers, and interests of readers worldwide
How to Use This Study Guide 1
1 The Definition and Interaction of Trends 3
2 Financial Markets and the Business Cycle 9
3 Dow Theory 15
4 Typical Parameters for Intermediate Trends 21
5 How to Identify Support and Resistance Zones 27
6 Trendlines 33
7 Basic Characteristics of Volume 41
8 Classic Price Patterns 49
9 Smaller Price Patterns and Gaps 59
10 One- and Two-Bar Price Patterns 65
11 Moving Averages 71
12 Envelopes and Bollinger Bands 77
13 Momentum I: Basic Principles 83
14 Momentum II: Individual Indicators 91
15 Momentum III: Individual Indicators 97
16 Candlestick Charting 107
17 Point and Figure Charting 115
18 Miscellaneous Techniques for Determining Trends 119
19 The Concept of Relative Strength 127
21 Price: The Major Averages 133
22 Price: Sector Rotation 139
23 Time: Analyzing Secular Trends for Stocks,Bonds, and Commodities 145
24 Time: Cycles and Seasonal Patterns 151
25 Practical Identification of Cycles 157
26 Volume II: Volume Indicators 161
27 Market Breadth 169
28 Indicators and Relationships That Measure Confidence 175
29 The Importance of Sentiment 181
30 Integrating Contrary Opinion and Technical Analysis 187
31 Why Interest Rates Affect the Stock Market 193
32 Using Technical Analysis to Select Individual Stocks 197
33 Technical Analysis of International Stock Markets 203
34 Automated Trading Systems 209
Index 214
| Erscheint lt. Verlag | 16.2.2014 |
|---|---|
| Zusatzinfo | 125 Illustrations |
| Sprache | englisch |
| Maße | 155 x 226 mm |
| Gewicht | 310 g |
| Themenwelt | Mathematik / Informatik ► Mathematik ► Finanz- / Wirtschaftsmathematik |
| Wirtschaft ► Betriebswirtschaft / Management ► Finanzierung | |
| ISBN-10 | 0-07-182398-0 / 0071823980 |
| ISBN-13 | 978-0-07-182398-2 / 9780071823982 |
| Zustand | Neuware |
| Haben Sie eine Frage zum Produkt? |
aus dem Bereich


