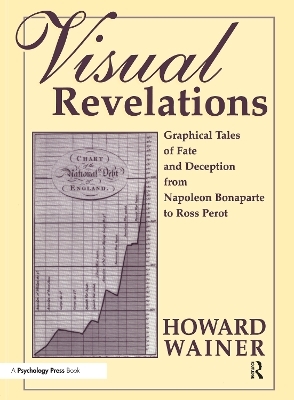
Visual Revelations
Psychology Press (Verlag)
978-0-8058-3878-7 (ISBN)
To function in modern society complex data must be absorbed and understood at a breakneck pace. The most efficient way to do this is through data-based graphics. This book is an exploration and celebration of graphical methods of data presentation.
Visual Revelations' principal purpose is to enlighten, inform, and amuse the reader regarding the shortcomings of common graphical practices; particularly how they can misinform while simultaneously providing models of wonderful graphics. There are many examples of the best graphic practice, graphs that go beyond conveying, facts, and structure to be able to carry emotion as well.
Aimed at an educated, lay audience, this volume benefits anyone who must either convey or receive quantitative information, including designers, statisticians, and people in the media.
Wainer Howard
Contents: Introduction. Part I: Graphical Failures. How to Display Data Badly. Graphical Mysteries. Part II: Graphical Triumphs. Graphical Answers to Scientific Questions. Three Graphic Memorials. A Nobel Graph. Todai Moto Kurashi. Picturing an L.A. Bus Schedule. Part III: Graphical Forms. Humble Pie. Double Y-Axis Graphs. Tabular Presentation. A Rose by Another Name. Trilinear Plots. Implicit Graphs. Part IV: Using Graphical Methods. Measuring Graphicacy. Graphs in the Presidential Campaign: Why Weren't They Used More Broadly? Visual Aids When Comparing an Apple to the Stars. Part V: Improving Graphical Presentations. Integrating Figures and Text. Elegance, Grace, Impact, and Graphical Displays. Sense-Lining. Making Readable Overhead Displays.
| Erscheint lt. Verlag | 12.8.2000 |
|---|---|
| Verlagsort | Philadelphia |
| Sprache | englisch |
| Maße | 210 x 280 mm |
| Gewicht | 793 g |
| Themenwelt | Mathematik / Informatik ► Mathematik ► Graphentheorie |
| ISBN-10 | 0-8058-3878-3 / 0805838783 |
| ISBN-13 | 978-0-8058-3878-7 / 9780805838787 |
| Zustand | Neuware |
| Haben Sie eine Frage zum Produkt? |
aus dem Bereich
