Intro Stats, plus MyStatLab with Pearson eText
Pearson Education Limited
978-1-4479-5496-5 (ISBN)
- Titel erscheint in neuer Auflage
- Artikel merken
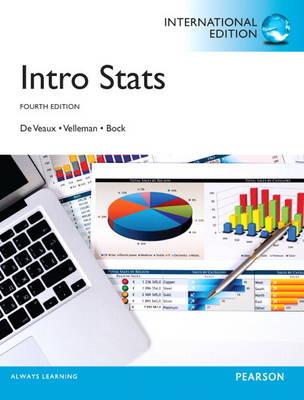
Richard De Veaux, Paul Velleman, and David Bock wrote Intro Stats with the goal that students and instructors have as much fun reading it as they did writing it. Maintaining a conversational, humorous, and informal writing style, this new edition engages students from the first page.
The authors focus on statistical thinking throughout the text and rely on technology for calculations. As a result, students can focus on developing their conceptual understanding. Innovative Think/Show/Tell examples give students a problem-solving framework and, more importantly, a way to think through any statistics problem and present their results.
New to the Fourth Edition is a streamlined presentation that keeps students focused on what's most important, while including out helpful features. An updated organization divides chapters into sections, with specific learning objectives to keep students on track. A detailed table of contents assists with navigation through this new layout. Single-concept exercises complement the existing mid- to hard-level exercises for basic skill development.
MyLab and Mastering from Pearson improve results for students and educators. Used by over ten million students, they effectively engage learners at every stage.
MyStatLab is being used in universities all over the world to improve student performance. MyStatLab has immersive content and engaging tools, along with time-saving automatic grading. "What students especially like about the system is that they get immediate feedback from MyStatLab on whether the exercise was right or wrong. I would recommend MyStatLab to another lecturer because I think I became a better lecturer in statistics, [as now] I'm able to provide individual students with better feedback." - Dr Patrick Stroobandt, Plantijn Hogeschool, Belgium
With MyStatLab, students gain knowledge that they will use throughout their lives, and universities gain a partner deeply committed to helping students and educators achieve their goals.
For students
Pearson eText gives you access to an eBook that can be used on the go, and allows you to highlight, search and take notes as you read online. Access to the eBook depends on the package you have bought.
Help Me Solve This breaks the problem down into manageable chunks so you can work through the methodology a stage at a time, applying what you've learnt as you go along.
MyStatLab questions often require you to draw or interpret graphs or statistical data. The integrated StatCrunch software allows your students to analyse the data set in the question and draw conclusions with a simple click.
For educators
Online assignments, tests, quizzes can be easily created and assigned to students.
Gradebook: Assignments are automatically graded and visible at a glance.
Register now to benefit from these resources.
A student access code card is included with your textbook at a reduced cost. To register with your code, visit www.mystatlab.co.uk.
For educator access, contact your Pearson account manager. To find out who your account manager is, visit www.pearsoned.co.uk/replocator
For more instructor resources available with this title, visit www.pearsoned
Dick De Veaux (Williams College) is an award-winning teacher and consultant to major corporations. His real-world experiences and anecdotes illustrate many of the chapters. Dick has taught business students at Wharton, engineering students at Princeton, and liberal arts students at Williams. Dick was named the 2008 Mosteller Statistician of the Year, awarded by the Boston chapter of the American Statistical Association for exceptional contributions to the field of statistics and outstanding service to the statistical community. To learn more, please go to: http://www.williams.edu/admin/news/releases/1624/. Paul Velleman (Cornell University) is the only statistician to win the EDUCAUSE award for innovating technology for learning. The developer of ActivStats (R) multimedia software, Data Desk (R) statistics software, and the DASL online archive of teaching datasets, his understanding of using and teaching with technology informs much of the book's approach. David Bock (Cornell University) won awards as a high school teacher of AP calculus and statistics and was a grader for the AP Statistics program from its inception. He is now the chief extension officer for the Cornell University mathematics department in charge of outreach to K-12 teachers. Dave's wisdom about how students learn helps to shape the book's pedagogy.
Preface
Index of Applications
Part I. Exploring and Understanding Data
1. Stats Starts Here!
1.1 What Is Statistics?
1.2 Data
1.3 Variables
2. Displaying and Describing Categorical Data
2.1 Summarizing and Displaying a Single Categorical Variable
2.2 Exploring the Relationship Between Two Categorical Variables
3. Displaying and Summarizing Quantitative Data
3.1 Displaying Quantitative Variables
3.2 Shape
3.3 Center
3.4 Spread
3.5 Boxplots and 5-Number Summaries
3.6 The Center of Symmetric Distributions: The Mean
3.7 The Spread of Symmetric Distributions: The Standard Deviation
3.8 Summary-What to Tell About a Quantitative Variable
4. Understanding and Comparing Distributions
4.1 Comparing Groups with Histograms
4.2 Comparing Groups with Boxplots
4.3 Outliers
4.4 Timeplots: Order, Please!
4.5 Re-expressing Data: A First Look
5. The Standard Deviation as a Ruler and the Normal Model
5.1 Standardizing with z-Scores
5.2 Shifting and Scaling
5.3 Normal Models
5.4 Finding Normal Percentiles
5.5 Normal Probability Plots
Review of Part I. Exploring and Understanding Data
Part II. Exploring Relationships Between Variables
6. Scatterplots, Association, and Correlation
6.1 Scatterplots
6.2 Correlation
6.3 Warning: Correlation Causation
6.4 Straightening Scatterplots
7. Linear Regression
7.1 Least Squares: The Line of "Best Fit"
7.2 The Linear Model
7.3 Finding the Least Squares Line
7.4 Regression to the Mean
7.5 Examining the Residuals
7.6 R2-The Variation Accounted for by the Model
7.7 Regression Assumptions and Conditions
8. Regression Wisdom
8.1 Examining Residuals
8.2 Extrapolation: Reaching Beyond the Data
8.3 Outliers, Leverage, and Influence
8.4 Lurking Variables and Causation
8.5 Working with Summary Values
Review of Part II. Exploring Relationships Between Variables
Part III. Gathering Data
9. Understanding Randomness
9.1 What is Randomness?
9.2 Simulating By Hand
10. Sample Surveys
10.1 The Three Big Ideas of Sampling
10.2 Populations and Parameters
10.3 Simple Random Samples
10.4 Other Sampling Designs
10.5 From the Population to the Sample: You Can't Always Get What You Want
10.6 The Valid Survey
10.7 Common Sampling Mistakes, or How to Sample Badly
11. Experiments and Observational Studies
11.1 Observational Studies
11.2 Randomized, Comparative Experiments
11.3 The Four Principles of Experimental Design
11.4 Control Treatments
11.5 Blocking
11.6 Confounding
Review of Part III. Gathering Data
Part IV. Randomness and Probability
12. From Randomness to Probability
12.1 Random Phenomena
12.2 Modeling Probability
12.3 Formal Probability
13. Probability Rules!
13.1 The General Addition Rule
13.2 Conditional Probability and the General Multiplication Rule
13.3 Independence
13.4 Picturing Probability: Tables, Venn Diagrams and Trees
13.5 Reversing the Conditioning and Bayes' Rule
14. Random Variables and Probability Models
14.1 Expected Value: Center
14.2 Standard Deviation
14.3 Combining Random Variables
14.4 The Binomial Model
14.5 Modeling the Binomial with a Normal Model
*14.6 The Poisson Model
14.7 Continuous Random Variables
Review of Part IV Randomness and Probability
Part V. From the Data at Hand to the World at Large
15. Sampling Distribution Models
15.1 Sampling Distribution of a Proportion
15.2 When Does the Normal Model Work? Assumptions and Conditions
15.3 The Sampling Distribution of Other Statistics
15.4 The Central Limit Theorem: The Fundamental Theorem of Statistics
15.5 Sampling Distributions: A Summary
16. Confidence Intervals for Proportions
16.1 A Confidence Interval
16.2 Interpreting Confidence Intervals: What Does 95% Confidence Really Mean?
16.3 Margin of Error: Certainty vs. Precision
16.4 Assumptions and Conditions
17. Testing Hypotheses About Proportions
17.1 Hypotheses
17.2 P-Values
17.3 The Reasoning of Hypothesis Testing
17.4 Alternative Alternatives
17.5 P-Values and Decisions: What to Tell About a Hypothesis Test
18. Inferences About Means
18.1: Getting Started: The Central Limit Theorem (Again)
18.2: Gosset's t
18.3 Interpreting Confidence Intervals
18.4 A Hypothesis Test for the Mean
18.5 Choosing the Sample Size
19. More About Tests and Intervals
19.1 Choosing Hypotheses
19.2 How to Think About P Values
19.3 Alpha Levels
19.4 Practical vs. Statistical Significance
19.5 Critical Values Again
19.6 Errors
19.7 Power
Review of Part V From the Data at Hand to the World at Large
Part VI. Learning About the World
20. Comparing Groups
20.1 The Variance of a Difference
20.2 The Standard Deviation of the Difference Between Two Proportions
20.3 Assumptions and Conditions for Comparing Proportions
20.4 The Sampling Distribution of the Difference between Two Proportions
20.5 Comparing Two Means
20.6 The Two-Sample t-Test: Testing for the Difference Between Two Means
20.7 The Two Sample z-Test: Testing for the Difference between Proportions
20.8 The Pooled t-Test: Everyone into the Pool?
20.9 Pooling
21. Paired Samples and Blocks
21.1 Paired Data
21.2 Assumptions and Conditions
21.3 Confidence Intervals for Matched Pairs
21.4 Blocking
22. Comparing Counts
22.1 Goodness-of-Fit Tests
22.2 Chi-Square Test of Homogeneity
22.3 Examining the Residuals
22.4 Chi-Square Test of Independence
23. Inferences for Regression
23.1 The Population and the Sample
23.2 Assumptions and Conditions
23.3 Intuition About Regression Inference
23.4 Regression Inference
23.5 Standard Errors for Predicted Values
23.6 Confidence Intervals for
Predicted Values
*23.7 Logistic Regression
Review of Part VI Learning About the World
Part VII. Inference When Variables Are Related
24 Analysis of Variance
24.1 Testing Whether the Means of Several Groups Are Equal
24.2 The ANOVA Table
24.3 Plot the Data...
24.4 Comparing Means
25. Multiple Regression
25.1 Two Predictors
25.2 What Multiple Regression Coefficients Mean
25.3 The Multiple Regression Model
25.4 Multiple Regression Inference
25.5 Comparing Multiple Regression Models
Appendices
A. Answers
B. Photo Acknowledgments
C. Index
D. Tables and Selected Formulas
*Indicates an optional section
| Erscheint lt. Verlag | 3.6.2013 |
|---|---|
| Verlagsort | Harlow |
| Sprache | englisch |
| Themenwelt | Mathematik / Informatik ► Mathematik |
| ISBN-10 | 1-4479-5496-3 / 1447954963 |
| ISBN-13 | 978-1-4479-5496-5 / 9781447954965 |
| Zustand | Neuware |
| Haben Sie eine Frage zum Produkt? |
aus dem Bereich


