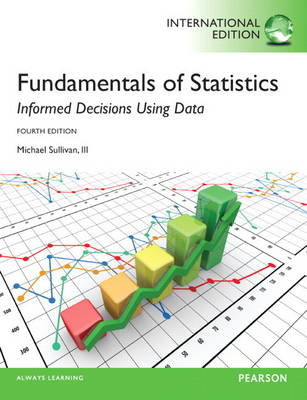
Fundamentals of Statistics, plus MyStatLab with Pearson eText
Pearson Education Limited
978-1-4479-5312-8 (ISBN)
- Titel wird leider nicht erscheinen
- Artikel merken
Drawing upon his passion for statistics and teaching, Mike Sullivan addresses the needs of today's students, the challenges teachers face, and changes in the statistics community. With feedback from his own students and classroom experience, Fundamentals of Statistics provides the tools to help students learn better and think statistically in a concise, friendly presentation.
MyLab and Mastering from Pearson improve results for students and educators. Used by over ten million students, they effectively engage learners at every stage.
MyStatLab is being used in universities all over the world to improve student performance. MyStatLab has immersive content and engaging tools, along with time-saving automatic grading. "What students especially like about the system is that they get immediate feedback from MyStatLab on whether the exercise was right or wrong. I would recommend MyStatLab to another lecturer because I think I became a better lecturer in statistics, [as now] I'm able to provide individual students with better feedback." - Dr Patrick Stroobandt, Plantijn Hogeschool, Belgium
With MyStatLab, students gain knowledge that they will use throughout their lives, and universities gain a partner deeply committed to helping students and educators achieve their goals.
For students
Pearson eText gives you access to an eBook that can be used on the go, and allows you to highlight, search and take notes as you read online. Access to the eBook depends on the package you have bought.
Help Me Solve This breaks the problem down into manageable chunks so you can work through the methodology a stage at a time, applying what you've learnt as you go along.
MyStatLab questions often require you to draw or interpret graphs or statistical data. The integrated StatCrunch software allows your students to analyse the data set in the question and draw conclusions with a simple click.
For educators
Online assignments, tests, quizzes can be easily created and assigned to students.
Gradebook: Assignments are automatically graded and visible at a glance.
Register now to benefit from these resources.
A student access code card is included with your textbook at a reduced cost. To register with your code, visit www.mystatlab.co.uk.
For educator access, contact your Pearson account manager. To find out who your account manager is, visit www.pearsoned.co.uk/replocator
For more instructor resources available with this title, visit www.pearsoned.co.uk
With training in mathematics, statistics, and economics, Mike Sullivan, III has a varied teaching background that includes 15 years of instruction in both high school and college-level mathematics. He is currently a full-time professor of mathematics and statistics at Joliet Junior College. Mike has numerous textbooks in publication in addition to his Introductory Statistics Series, which include a Developmental Math series, and a Precalculus series, which he writes with his father, Michael Sullivan. Mike has built this book in the classroom using feedback from his students. He is well aware of the challenges of students taking an introductory statistics course. His goal is for students to be more informed interpreters of data, so that they will be better decision makers and have stronger critical-thinking skills. When not in the classroom or writing, Mike enjoys spending time with his three children, Michael, Kevin, and Marissa, and playing golf. Follow Mike on Facebook (R) (www.facebook.com/SullyStats) and Twitter (@SullyStats).
Part 1: Getting the Information You Need
1. Data Collection
1.1 Introduction to the Practice of Statistics
1.2 Observational Studies versus Designed Experiments
1.3 Simple Random Sampling
1.4 Other Effective Sampling Methods
1.5 Bias in Sampling
1.6 The Design of Experiments
Chapter 1 Review
Chapter Test
Making an Informed Decision: What College Should I Attend?
Case Study: Chrysalises for Cash
Part 2: Descriptive Statistics
2. Organizing and Summarizing Data
2.1 Organizing Qualitative Data
2.2 Organizing Quantitative Data: The Popular Displays
2.3 Graphical Misrepresentations of Data
Chapter 2 Review
Chapter Test
Making an Informed Decision: Tables or Graphs?
Case Study: The Day the Sky Roared
3. Numerically Summarizing Data
3.1 Measures of Central Tendency
3.2 Measures of Dispersion
3.3 Measures of Central Tendency and Dispersion from Grouped Data
3.4 Measures of Position and Outliers
3.5 The Five-Number Summary and Boxplots
Chapter 3 Review
Chapter Test
Making an Informed Decision: What Car Should I Buy?
Case Study: Who Was A Mourner?
4. Describing the Relation between Two Variables
4.1 Scatter Diagrams and Correlation
4.2 Least-Squares Regression
4.3 The Coefficient of Determination
4.4 Contingency Tables and Association
Chapter 4 Review
Chapter Test
Making an Informed Decision: Relationships among Variables on a World Scale
Case Study: Thomas Malthus, Population, and Subsistence
Part 3: Probability and Probability Distributions
5. Probability
5.1 Probability Rules
5.2 The Addition Rule and Complements
5.3 Independence and the Multiplication Rule
5.4 Conditional Probability and the General Multiplication Rule
5.5 Counting Techniques
5.6 Putting It Together: Which Method Do I Use?
Chapter 5 Review
Chapter Test
Making an Informed Decision: The Effects of Drinking and Driving
Case Study: The Case of the Body in the Bag
6. Discrete Probability Distributions
6.1 Discrete Random Variables
6.2 The Binomial Probability Distribution
Chapter 6 Review
Chapter Test
Making an Informed Decision: Should We Convict?
Case Study: The Voyage of the St. Andrew
7. The Normal Probability Distribution
7.1 Properties of the Normal Distribution
7.2 Applications of the Normal Distribution
7.3 Assessing Normality
7.4 The Normal Approximation to the Binomial Probability Distribution
Chapter 7 Review
Chapter Test
Making an Informed Decision: Stock Picking
Case Study: A Tale of Blood Chemistry and Health
Part 4: Inference: From Samples to Population
8. Sampling Distributions
8.1 Distribution of the Sample Mean
8.2 Distribution of the Sample Proportion
Chapter 8 Review
Chapter Test
Making an Informed Decision: How Much Time Do You Spend in a Day...?
Case Study: Sampling Distribution of the Median
9. Estimating the Value of a Parameter
9.1 Estimating a Population Proportion
9.2 Estimating a Population Mean
9.3 Putting It Together: Which Procedure Do I Use?
Chapter 9 Review
Chapter Test
Making an Informed Decision: How Much Should I Spend for This House?
Case Study: Fire-Safe Cigarettes
10. Hypothesis Tests Regarding a Parameter
10.1 The Language of Hypothesis Testing
10.2 Hypothesis Tests for a Population Proportion
10.3 Hypothesis Tests for a Population Mean
10.4 Putting It Together: Which Method Do I Use?
Chapter 10 Review
Chapter Test
Making an Informed Decision: Selecting a Mutual Fund
Case Study: How Old Is Stonehenge?
11. Inferences on Two Samples
11.1 Inference about Two Population Proportions
11.2 Inference about Two Means: Dependent Samples
11.3 Inference about Two Means: Independent Samples
11.4 Putting It Together: Which Method Do I Use?
Chapter 11 Review
Chapter Test
Making an Informed Decision: Which Car Should I Buy?
Case Study: Control in the Design of an Experiment
12. Inference on Categorical Data
12.1 Goodness-of-Fit Test
12.2 Tests for Independence and the Homogeneity of Proportions
12.3 Testing the Significance of the Least-Squares Regression Model
12.4 Confidence and Prediction Intervals
Chapter 12 Review
Chapter Test
Making an Informed Decision: Benefits of College
Case Study: Feeling Lucky? Well, Are You?
Additional Topics on CD
C.1 Lines
C.2 Estimating a Population Standard Deviation
C.3 Hypothesis Tests for a Population Standard Deviation
C.4 Comparing Three or More Means (One-Way Analysis of Variance)
Appendix A. Tables
Photo Credits
Answers
Index
| Erscheint lt. Verlag | 3.2.2014 |
|---|---|
| Verlagsort | Harlow |
| Sprache | englisch |
| Themenwelt | Mathematik / Informatik ► Mathematik |
| ISBN-10 | 1-4479-5312-6 / 1447953126 |
| ISBN-13 | 978-1-4479-5312-8 / 9781447953128 |
| Zustand | Neuware |
| Haben Sie eine Frage zum Produkt? |
aus dem Bereich

